
Benchmarking emerging chromatographic platforms for mRNA-LNP characterization and scalable process enablement
Cell & Gene Therapy Insights 2026; 12(7), 767–785
DOI: 10.18609/cgti.2026.094
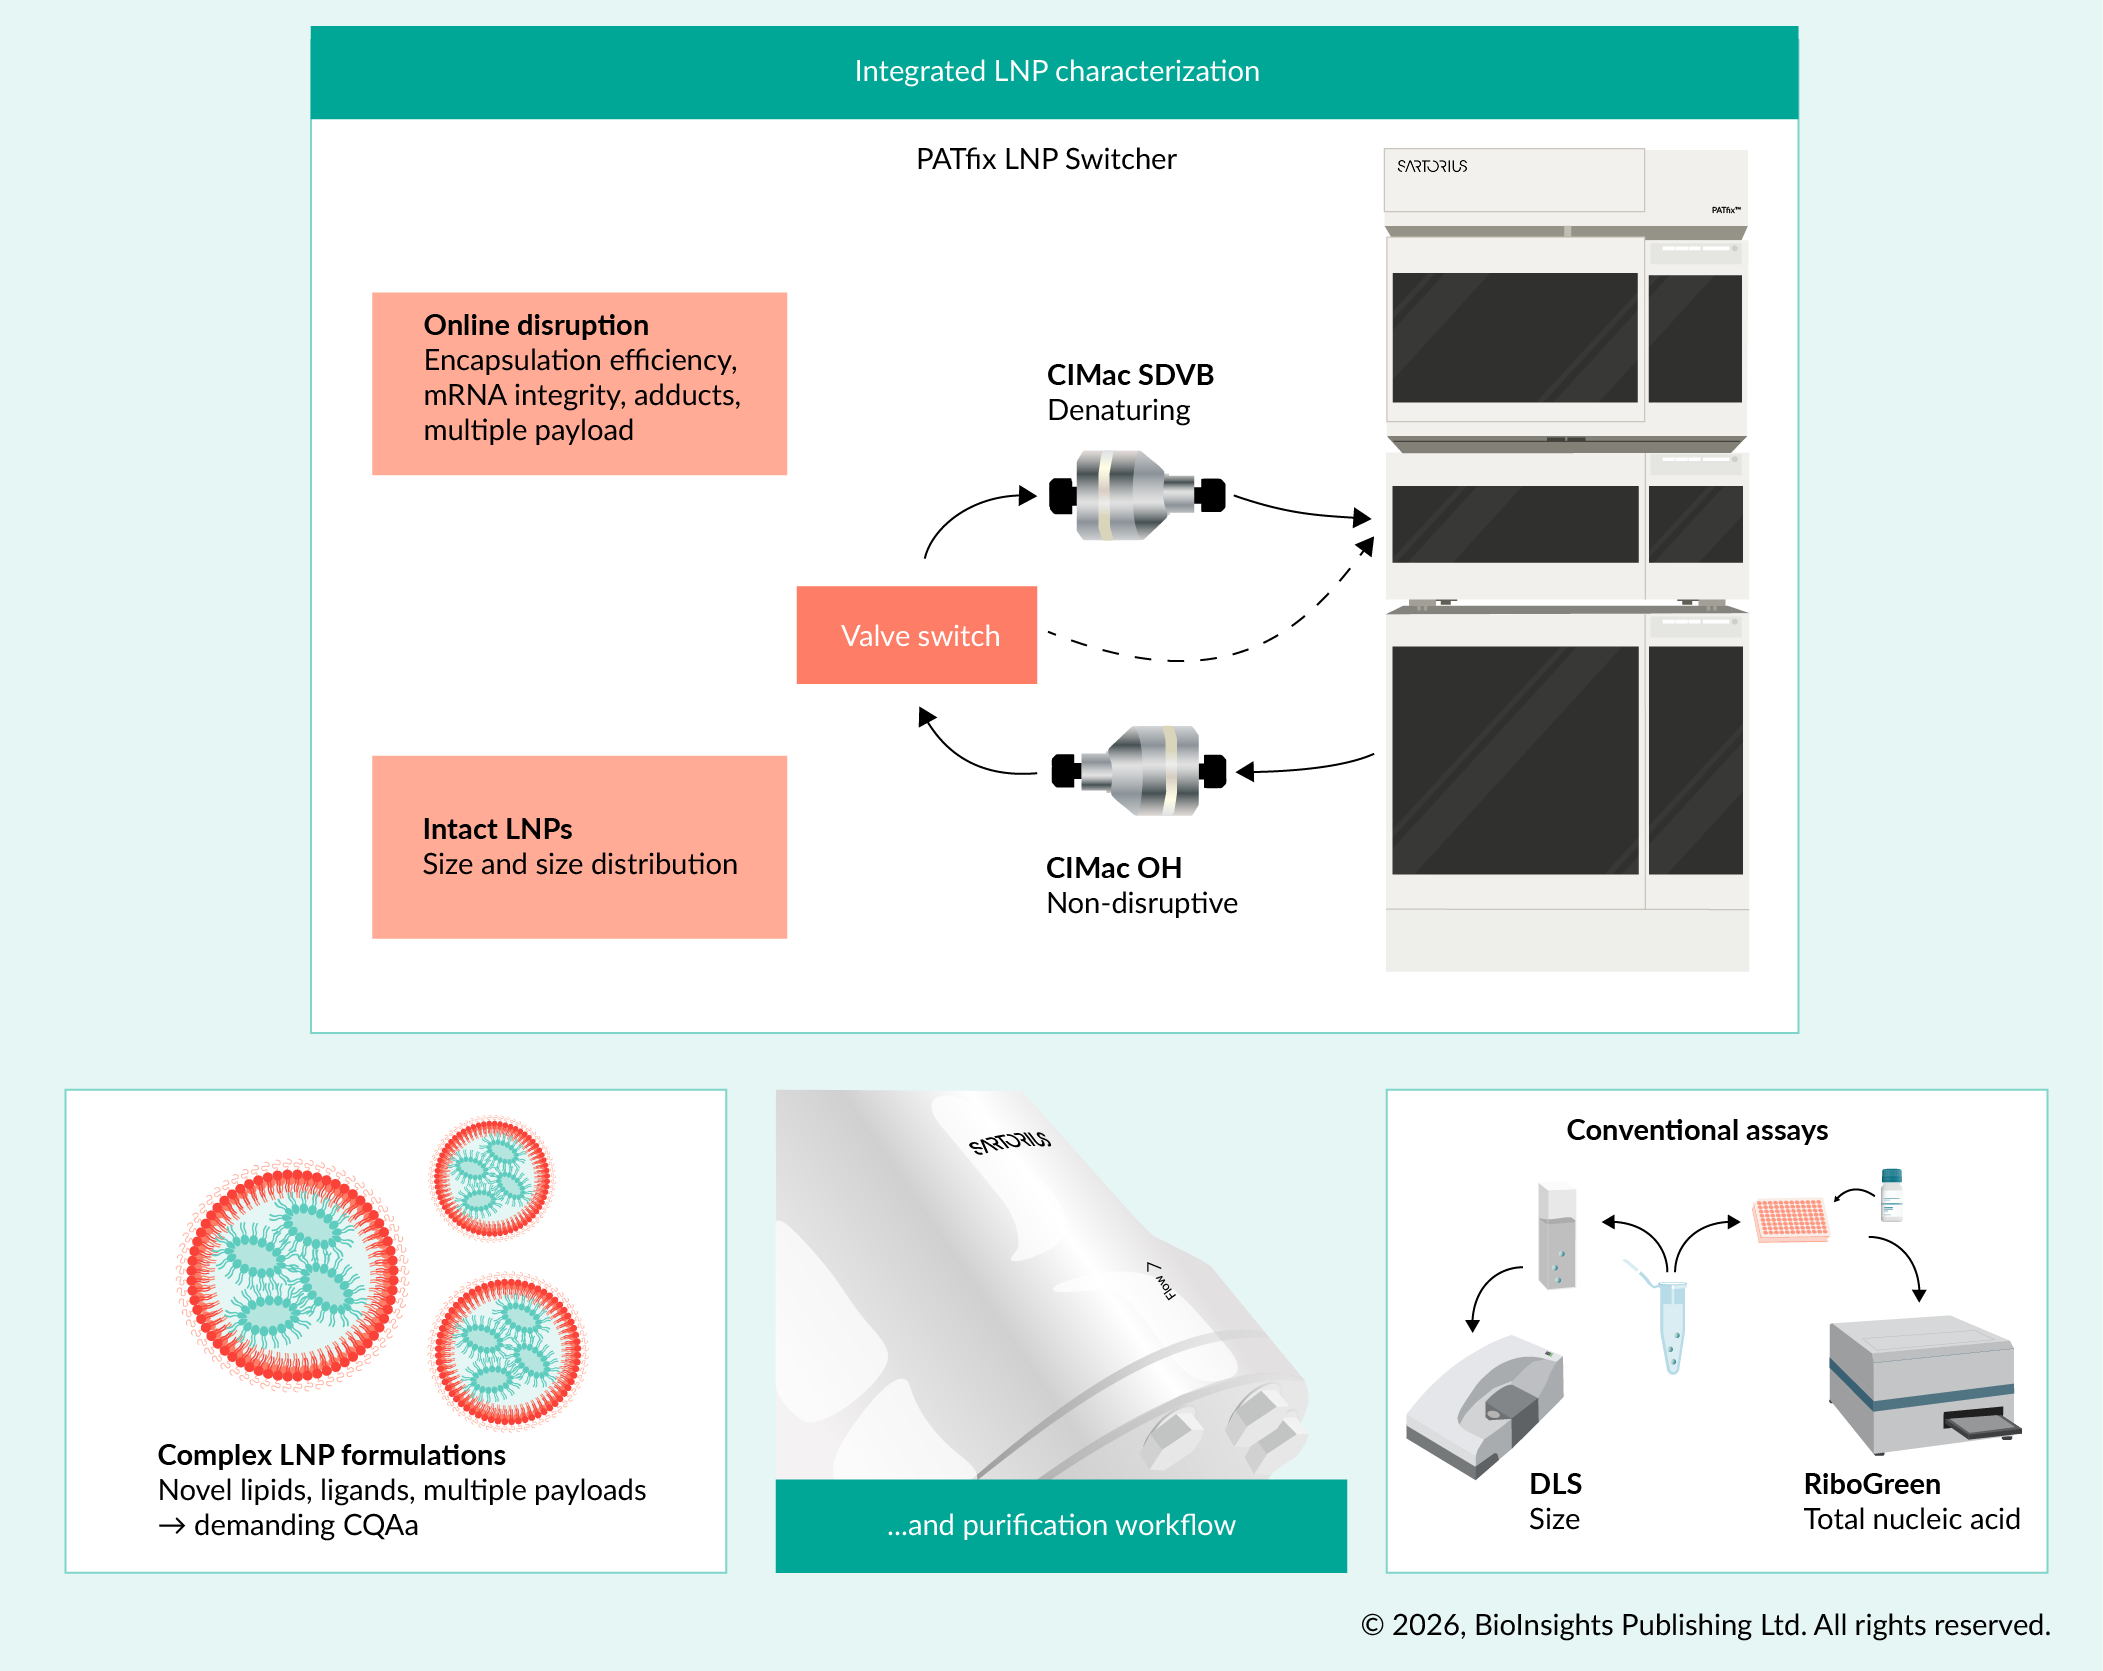
Lipid nanoparticles (LNPs) are now the leading delivery platform for nucleic acid therapeutics, supporting applications from prophylactic mRNA vaccines to in vivo gene editing, in vivo CAR-T, protein replacement, and personalized cancer immunotherapy. As formulations incorporate novel ionizable lipids, targeting ligands, and multi-component payloads, analytical complexity increases, and no single method can capture all critical quality attributes (CQAs). This study benchmarks the PATfix LNP Switcher Platform against established (RiboGreen, DLS) and emerging (FFF-UV-MALS-DLS-RI) techniques. The 2D LNP Switcher uses independent flow paths, dual UV-Vis/MALS detection, and automated switching between non-disruptive and denaturing modes, enabling preparation-free analysis of intact particles followed by online disruption to quantify encapsulated nucleic acid, free mRNA, and lipid–mRNA adducts. This platform supports integrated, multi-parameter LNP characterization that aligns process development, manufacturing, and evolving regulatory expectations, and complements the scalable, preparative purification of mRNA-LNPs on CIMmultus OH monoliths.
 |
| Graphical abstract. © 2026, BioInsights Publishing Ltd. All rights reserved. |
Lipid nanoparticles (LNPs) have emerged as the predominant delivery platform for nucleic acid therapeutics, enabling transformative clinical applications ranging from prophylactic mRNA vaccines to in vivo gene editing, gene therapy, protein replacement therapies, and personalized cancer immunotherapies [1–4]. As LNP formulations become increasingly complex, incorporating novel ionizable lipids, targeting ligands, and multi-component payloads—the analytical challenges expand proportionally. No single methodology can fully address the multifaceted critical quality attributes (CQAs) governing LNP safety and efficacy, necessitating a diversified, orthogonal analytical toolkit.
Herein, we benchmark a 2D-HPLC system previously developed by our team, the PATfix LNP Switcher [5], against established and emerging analytical techniques to evaluate its contribution to comprehensive LNP characterization. The LNP Switcher utilizes a two dimensional chromatography configuration with independent flow paths, UV-Vis and MALS detection, and automated valve switching between non-disruptive and disruptive separation modes. The first column is a hydrophobic interaction chromatography (HIC) monolithic column, CIM OH, which enables intact separation of biomolecules according to their hydrophobicity. Non-disruptive conditions are used, including the addition of kosmotropic salts to bind molecules to the monolith surface via the salting-out effect. Because nanoparticles such as LNPs are highly hydrophobic due to their lipid structure and size, a relatively low concentration of kosmotropic salt is sufficient to bind them. Much higher salt concentrations are required to bind mRNA, enabling seamless separation of these two species. In the second step, a strongly hydrophobic CIM SDVB column is used for reverse-phase analytics under disruptive conditions (organic solvent, high temperature, ion-pairing reagent). With this method, nucleic acid cargoes can be separated by hydrophobicity under denaturing conditions, which also enables size separation. They can be quantified by UV, and further hydrophobic impurities, such as adducts, can be detected. This architecture enables direct, preparation-free analysis: intact particles are first characterized for size and scattering properties, followed by online particle disruption, combining strong lipid-column hydrophobic interaction, organic solvent composition and elevated temperature, to release and quantify encapsulated nucleic acid, free mRNA, and lipid-mRNA adducts [6,7] – covalent associations that compromise formulation (mRNA) efficacy and regulatory compliance [8].
Comparative analysis positioned the PATfix LNP Switcher alongside gold standard techniques included in the regulatory guidelines, fluorescence (RiboGreen™) assays and dynamic light scattering (DLS) [9], as well as emerging asymmetric flow field-flow fractionation (AF4) coupled with UV, MALS, and DLS detection (AF4-UV-MALS-DLS) [10,11]. The expanding landscape of LNP analytics reflects the field's evolution beyond ensemble measurements towards high-resolution, multi-parameter characterization. Advanced chromatographic platforms and field-flow fractionation methodologies address the limitations of traditional bulk assays by resolving particle heterogeneity, detecting subpopulations, and enabling absolute physicochemical quantification. The emergence of these technologies signals a broader shift in analytical strategy: comprehensive LNP characterization now demands integrated workflows capable of simultaneous size determination, payload quantification, and impurity detection. Establishing such multi-parameter methods is essential as therapeutic applications diversify and regulatory frameworks for complex nucleic acid products mature and should translate into cost savings and reduced complexity for the end user in the pharmaceutical industry.
Facile scalability with minimal need for method adaptation is a distinguishing hallmark of monolithic LC, compared with both packed-bed LC and other separation concepts. Thus, to enable scalable preparative LNP purification beyond the state of the art, a similar chromatographic approach can be used to obtain functional and uniform LNP particles [12]. CIMmultus OH monolithic columns demonstrated efficient impurity clearance compared with tangential flow filtration, supporting analytical continuity from development through to manufacturing implementation.
In this study, we systematically evaluated the PATfix LNP Switcher as an integrated platform for comprehensive lipid nanoparticle (LNP) characterization and benchmarked its performance against established analytical methods. We compared chromatography-based quantification of total RNA and encapsulation efficiency, determined by UV signal, with the RiboGreen fluorescence assay, and contrasted its MALS-derived particle size data with batch DLS and AF4-UV-MALS-DLS measurements. In addition, we exploited the chromatographic resolution of the PATfix LNP Switcher to assess payload integrity, including fragmentation and nucleic acid–lipid adducts, across a diverse panel of LNP formulations differing in ionizable lipids and nucleic acid cargo (mRNA, siRNA, ASO, and Cas9/gRNA).
Materials & methods
Materials
LNP formulation for analytical comparison
Lipid nanoparticle (LNP) formulations were prepared using a solvent-injection flow-mixing protocol. Briefly, lipid components were dissolved in ethanol to a total lipid concentration of 10 mM. RNA cargo was diluted in acetate buffer (25 mM, pH 4.5, Thermo Scientific™) prior to formulation. The amine-to-phosphate (N/P) ratio, defined as the molar ratio of ionizable or cationic lipid amines to RNA phosphate groups, was adjusted for each formulation as indicated in Table 1.
| Table 1. Composition and expected total RNA concentration of prepared LNP samples. | |||||||
|---|---|---|---|---|---|---|---|
| Sample | Lipid composition | Lipid molar ratio (%) | N/P | Type of RNA | Spiked free RNA (%, w/w of total RNA) | Theoretical total lipid (mg/mL) | Theoretical total RNA (μg/mL) |
| LNP-1 | SM-102 / cholesterol/ DSPC / PEG-DMG (ionizable cationic) | 50/38.5/10/1.5 | 6 | mRNA | 0 | 1.5 | 38.6 |
| LNP-2 | SM-102 / cholesterol/ DSPC / PEG-DMG (ionizable cationic) | 50/38.5/10/1.5 | 6 | mRNA | 5 | 1.5 | 44.0 |
| LNP-3 | SM-102/cholesterol/DSPC/PEG-DMG (ionizable cationic) | 50/38.5/10/1.5 | 6 | mRNA | 30 | 1.5 | 69.0 |
| LNP-4 | SM-102/cholesterol/DOPE/PEG2000-DMG (ionizable cationic) | 39/21/38/2 | 7 | Cas9 mRNA + gRNA (4:1 ratio) | NA | 1.4 | 36.1 |
| LNP-5 | SM-102/cholesterol/DOTAP/PEG2000-DMG (permanent cationic) | 39/21/38/2 | 7 | Cre mRNA | NA | 2.2 | 255.4 |
| LNP-6 | ZA3-Ep10/cholesterol/PEG-DMG (zwitterionic) | 50/38.5/2.5 | 7 | Cre mRNA | NA | 1.6 | 47.9 |
| LNP-7 | cKK-E12/β-sitosterol/DOPE/C14-PEG2000 (ionizable cationic) | 35/18/44.5/2.5 | 3 | Antisense oligonucleotide (AON RND) | NA | 1.6 | 93.0 |
| LNP-8 | 246-C10/Chol/DSPC/C16-ceramide-PEG/DSPE-mannose-PEG (ionizable cationic) | 26.5/50.5/20/0.5/2.5 | 3 | siRNA (scrambled sequence) | NA | 22.3 | 596.6 |
| NA: Not applicable. | |||||||
LNPs were prepared using a flow-mixing approach with a T-junction mixer (CapTite Interconnect Tee, LabSmith) connected to two automated syringe pumps (New Era Pump Systems). The lipid–ethanol phase and RNA–aqueous phase were injected into the mixer at a total flow rate of 12 mL·min-1 with an organic-to-aqueous flow rate ratio of 1:3. Under these conditions, the lipid solution is diluted four-fold during mixing, yielding a final total lipid concentration of 2.5 mM immediately after formulation.
Following mixing, LNP dispersions were dialyzed overnight against Tris-HCl buffer (10 mM, pH 7.5) using 10 kDa molecular weight cut-off dialysis cassettes (Slide-A-Lyzer™ G2, Thermo Scientific™) to remove ethanol and adjust the formulation to physiological pH.
LNP-1, LNP-2, and LNP-3 differed only in the proportion of externally spiked free RNA relative to total RNA content (0%, 5%, and 30%, respectively), while all other parameters were kept constant.
Stock LNP formulations were used as provided and diluted as required for individual analytical methods (chromatography, dynamic light scattering, field-flow fractionation, and RiboGreen assay), using the corresponding assay buffers described in the respective sections. All expected total RNA concentrations reported in Table 1 refer to the undiluted LNP stocks.
PATfix LNP switcher platform analysis
All chromatographic analyses of LNP samples were performed on a PATfix LNP Switcher system (Sartorius BIA Separations) as previously described [5] equipped with two quaternary pumps, a multiwavelength UV–Vis detector (50 mm flow cell path length), a multi-angle light scattering (MALS) detector, a cooled autosampler (4 °C), a column oven, and an 8-port valve. Instrument control and data processing were carried out using PATfix software (Sartorius BIA Separations).
LNP samples were analyzed using a 0.1 mL CIMac OH analytical column (6 μm channel size) and a 0.1 mL CIMac SDVB analytical column (2 μm channel size) (Sartorius BIA Separations). Prior to injection, samples were appropriately diluted with OH loading buffer (200 mM sodium citrate, 15 mM Tris, pH 8.0). The injection volume was 500 μL. The SDVB column was maintained at 60 °C during analysis.
UV detection was performed at 260 nm, and MALS signals were recorded at nine scattering angles (28, 44, 60, 76, 90, 108, 124, 140, and 156°) for online characterization of LNPs.
Two buffer sets were used, one for each pump, corresponding to the OH and SDVB columns. For the CIMac OH column, the loading buffer was 200 mM sodium citrate, 15 mM Tris, pH 8.0, and the cleaning buffer was 50% (v/v) acetonitrile. The elution buffer for the OH column and the loading buffer for the SDVB column consisted of 200 mM triethylammonium acetate (TEAA), 7% (v/v) acetonitrile. For the CIMac SDVB column, the elution buffer was 98% (v/v) acetonitrile in water.
Orthogonal methods for the analysis of LNP samples
Particle analysis by FFF–UV–MALS–DLS-RI
Particle characterization was performed using an asymmetric flow field-flow fractionation system (FFF) hyphenated to ultraviolet (UV), multi-angle light scattering (MALS), dynamic light scattering (DLS) detectors and Refractive Index detector (Waters, Wyatt Technology).
Instrument setup and separation conditions
The separation was carried out using a dispersion inlet FFF channel equipped with a 400 μm spacer and a 10 kDa regenerated cellulose (RC) membrane. The mobile phase was 1× phosphate-buffered saline (PBS), pH 7.4. Samples were injected under standard FFF conditions as recommended by the manufacturer, with and without application of cross-flow, to enable both fractionation and recovery assessment.
Detectors and data acquisition
The FFF channel outlet was connected in series to UV, MALS, and DLS detectors. UV absorbance was monitored at 230 nm for quantification and recovery calculations. MALS data was collected at multiple scattering angles, and the online DLS detector was used to obtain hydrodynamic size information.
Determination of structural and size parameters
The radius of gyration (Rg, nm) was determined from the MALS data using the Berry model, as implemented in the instrument software. The hydrodynamic diameter (Rh, nm) was obtained from the online DLS detector and reported as the intensity-weighted mean hydrodynamic diameter of the eluting particles.
Particle concentration
Particle concentration (particles/mL) was calculated from the combined MALS signals using the instrument software, based on the measured scattering intensity and appropriate optical and concentration models for the particle system from the RI detector.
Recovery calculation
Method recovery was used as an indicator of formulation success, reflecting the proportion of formulation present as intact particles (e.g., lipid nanoparticles) versus free components (lipids/drug). Recovery was calculated by integrating the main UV peak area at 230 nm for each sample under two conditions: with cross-flow applied (fractionating conditions) and without cross-flow (non-fractionating, reference conditions). Recovery was expressed as a percentage using:
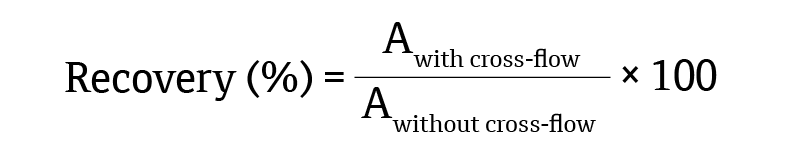
where 'Awith cross-flow' and 'Awithout cross-flow' are the integrated areas of the main UV peak at 230 nm.
Dynamic light scattering (DLS)
The hydrodynamic particle size of lipid nanoparticle (LNP) formulations was determined by dynamic light scattering (DLS) using a VascoKIN instrument (Cordouan Technologies, France).
Prior to measurement, samples were diluted 30-fold in 10 mM Tris-HCl buffer (pH 7.5 as used in formulation) to minimize multiple scattering while maintaining adequate signal intensity. All measurements were performed at 25 °C. For each sample, 10 independent measurements (replicates) were recorded to ensure statistical robustness.
The Z-average hydrodynamic diameter (Z-AVG, nm) was obtained from the intensity-weighted size distribution calculated by the instrument software. The polydispersity index (PdI) was determined using the Cumulants analysis algorithm applied to the autocorrelation function of the scattered light.
RiboGreen RNA quantification assay
RNA concentration in lipid nanoparticle (LNP) formulations was determined using the RiboGreen fluorescent RNA quantification kit (Invitrogen, USA), following the manufacturer's instructions with minor modifications.
Sample preparation
LNP samples were analyzed either undiluted or appropriately diluted in assay buffer to enable determination of both encapsulated and free (non-encapsulated) RNA. To quantify total RNA content, aliquots of each LNP sample were mixed with Triton X-100 to a final concentration of 2.5% (v/v) to disrupt the nanoparticles and release encapsulated RNA. Parallel aliquots of the same LNP samples were prepared without Triton X-100 to assess free RNA.
Calibration curve
A calibration curve was prepared using the same nucleic acid as that present in the LNP samples. Serial dilutions were prepared in assay buffer to obtain final RNA concentrations ranging from 0 to 640 ng/mL. For each concentration point, two sets of standards were prepared: one containing 2.5% (v/v) Triton X-100 and one set without Triton X-100, to match the conditions used for total and free RNA measurements, respectively. All calibration standards were prepared in triplicate and analyzed alongside the LNP samples.
RiboGreen assay and fluorescence measurement
RiboGreen working solution was prepared immediately before use according to the manufacturer's protocol. An equal volume of RiboGreen working solution was added to each standard and sample in 96-well microplates, followed by gentle mixing and incubation at room temperature protected from light for the time recommended by the kit instructions.
Fluorescence was measured using a Tecan iControl microplate reader. Samples were excited at 500 ± 10 nm, and fluorescence emission was recorded at 525 ± 10 nm. Background fluorescence from blank wells (assay buffer with and without Triton X-100, plus RiboGreen) was subtracted from all measurements. Calibration curves (with and without Triton X-100) were generated by plotting fluorescence intensity versus RNA concentration and fitted by linear regression. RNA concentrations in LNP samples were calculated from the corresponding calibration curve and expressed as total RNA (with Triton X-100) and free RNA (without Triton X-100).
LNP formulation for chromatographic purification
Ionizable lipid SM-102, cholesterol, DSPC and DMG-PEG-2000 were dissolved in ethanol at final concentration of 15 mM at the ratio of 46.3:42.7:8.9:1.6, while mLuc mRNA was diluted in 25 mM acetate, pH 5 to final concentration of 0.13 mg/mL. Lipid mixture was mixed with mRNA solution in 1:3 (v:v) ratio and N:P ratio of 6.09 at 12 mL/min using NanoAssemblr (Cytiva, USA). Following encapsulation LNPs were 10x diluted with 50 mM Tris, pH 7.4 to neutralize the sample.
Chromatographic purification for LNPs
Prior to the run, 1 mL CIMmultus OH column (Sartorius BIA Separations, Slovenia) was cleaned with 1 M NaOH and neutralized as stated in the instructions for use. Then the column was prepared for the run by washing with binding buffer, elution buffer, and, finally, binding buffer again. The binding buffer was 1:1 mixture of loading buffer, 15 mM Tris, 1 M Na-citrate, 200 mM sucrose; pH 7.4 and elution buffer, 15 mM Tris, 200 mM sucrose; pH 7.4, to achieve final 0.5 M Na-citrate concentration. LNP sample was further diluted in a 1:1 ratio with loading buffer to reach binding conditions of 15 mM Tris, 0.5 M Na-citrate, 200 mM sucrose, pH 7.4 and loaded on the column. The column was washed with 20 CV of binding buffer. Elution was performed with a step gradient to the elution buffer, and a 2 mL fraction was collected for further analysis. Any residual bound on the column was stripped with 50% ethanol. Flow rates during chromatography were 10 CV/min for loading and wash, 5 CV/min for elution, and 1 CV/min for ethanol strip.
Analytics of chromatographic purification
Elution fraction from purification run was analyzed with PATfix LNP Switcher as described previously to determine encapsulation efficiency, adduct formation and recovery. To determine their size LNP samples were appropriately diluted in 50 mM Tris, pH 7.4 and measured with nanoparticle tracking analysis (NTA; Nanosight Pro, Malvern Panalytical, United Kingdom). Furthermore, functional activity was assessed by expression of the encapsulated luciferase mRNA in HEK293 cells.
Results
A panel of eight lipid nanoparticle formulations (LNP-1 to LNP-8) was prepared and used for all analyses in this study, as shown in Table 1. Each LNP contained a specific ionizable (or cationic) lipid and nucleic acid cargo, with defined levels of free (non-encapsulated) RNA where applicable. The compositions and expected total RNA concentrations for each sample are summarized in Table 1. This panel was chosen to include a broad spectrum of APIs and excipients used in LNP formulation today and to demonstrate comparisons among analytical methods based on the type of LNP formulation.
mRNA concentration and encapsulation efficiency
Total RNA concentrations obtained with the PATfix LNP Switcher (representative chromatogram of sample LNP-1 presented in Figure 1) were compared to those measured by the RiboGreen assay and to the expected values based on formulation (input RNA at encapsulation).
| Figure 1. Representative PATfix LNP Switcher chromatogram of LNP-1. |
|---|
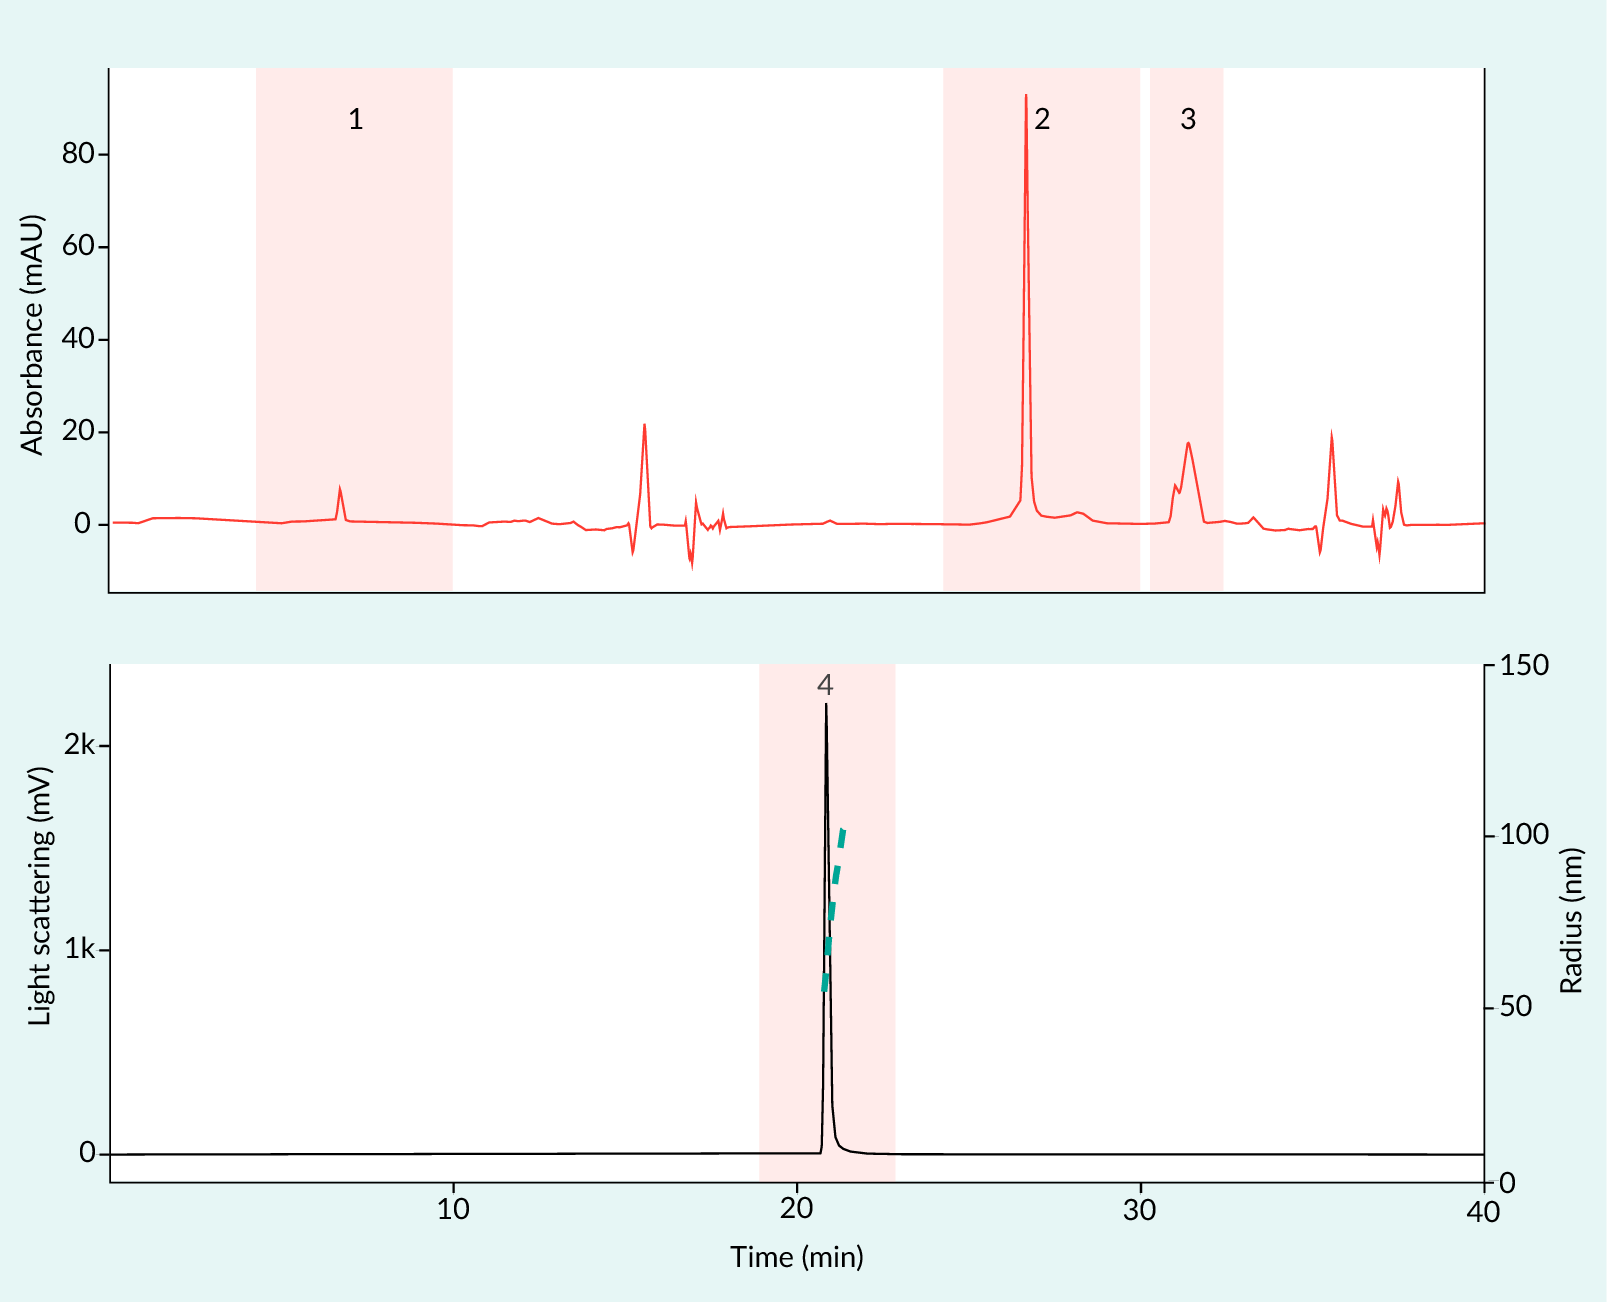 |
| Nucleic acids observed with UV detector, A 260 nm in red. 1: Free nucleic acids; 2: Encapsulated nucleic acids; 3: Nucleic acid-lipid adducts. Unmarked peaks correspond to blank peaks. Particles observed with MALS detector, LS 90° in black. 4: Particles. Calculated particle size from LS signals in turquoise dashed. |
Table 2 presents the comparative results. For simple SM-102-mRNA formulations with low or no free RNA (LNP-1 and LNP-2), the two analytical approaches showed good agreement. The average of Switcher and RiboGreen values was close to the expected total RNA concentration (LNP-1: 35.3 vs 38.6 μg/mL; LNP-2: 45.5 vs 44.0 μg/mL), and the RSD between methods was low (2.7% and 7.7%, respectively). This indicates that, within this range and formulation context, both methods provide comparable quantitative results.
| Table 2. Total RNA concentration determination. | ||||||
|---|---|---|---|---|---|---|
| Sample | Main lipid | Type of RNA | Total RNA concentration (μg/mL) Switcher results | Total RNA concentration (μg/mL) RiboGreen results | RSD of Switcher vs RiboGreen results | Theoretical concentration (μg/mL) |
| LNP-1 | SM-102 | mRNA | 34.6 | 36 | 2.7 | 38.6 |
| LNP-2 | SM-102 | mRNA | 43.0 | 48 | 7.7 | 44.0 |
| LNP-3 | SM-102 | mRNA | 63.8 | 122 | 44.3 | 69.0 |
| LNP-4 | SM-102 | gRNA | 5.4 | NA | NA | 36.1 |
| LNP-4 | SM-102 | Cas9 | 9.5 | NA | NA | 36.1 |
| LNP-5 | DOTAP | mRNA | 0.5 | NA | NA | 255.4 |
| LNP-6 | ZA3-Ep10 | mRNA | 26.7 | 52 | 45.5 | 47.9 |
| LNP-7 | CKK-E12 | ASO | 148.3 | - | - | 93.0 |
| LNP-8 | 246-C10 | siRNA | 1210.4 | 672 | 40.4 | 596.6 |
| NA: Not applicable. | ||||||
In contrast, notable discrepancies emerged in samples with higher free RNA content or more complex cargoes. For LNP-3 (30% free mRNA), the Switcher result (63.8 μg/mL) was closer to the expected 69.0 μg/mL, whereas RiboGreen yielded a markedly higher value (122 μg/mL), resulting in a high inter-method RSD (44.3%). This suggests that RiboGreen overestimates total RNA in formulations with substantial free RNA.
The PATfix LNP Switcher also enabled separate quantification of multiple RNA cargos within the same formulation. For LNP-4, Cas9 mRNA and gRNA were quantified individually (9.5 and 5.4 μg/mL, respectively), whereas RiboGreen could not differentiate between these species. For other non-mRNA cargos (ASO in LNP-7, siRNA in LNP-8), Switcher reported high RNA concentrations, and in the case of LNP-8, substantial divergence from RiboGreen was observed (1210.4 vs. 672 μg/mL; RSD 40.4%). LNP-5 and LNP-6 are specific cases: the first contains a permanent cationic lipid, DOTAP, and the second contains a zwitterionic lipid, ZA3-Ep10. The concentrations determined for these samples are much lower than expected. The divergence suggests formulation-specific matrix effects, which are a current limitation of the system and are being addressed. LNPs with permanent cationic lipids exhibit a much larger positive charge and a difference in hydrophobicity that requires further method optimization and generalization to robustly extract a stronger complexed mRNA. Collectively, these data demonstrate that the chromatographic PATfix LNP Switcher provides cargo-resolved, structurally selective quantification and is less susceptible to bias from free RNA than the bulk RiboGreen assay.
Similarly, encapsulation efficiency results obtained using the PATfix LNP Switcher were compared with those from the RiboGreen assay for formulations where both methods were applied. Results are presented in Figure 2. For SM-102–mRNA LNPs with low or moderate free RNA (LNP-1 and LNP-2), the two methods again produced closely aligned values. For LNP-1, encapsulation efficiencies of 96% (Switcher) and 90% (RiboGreen) were obtained, yielding an average of 93% and an inter-method RSD of 4.8%. For LNP-2, the corresponding values were 81% (Switcher) and 80% (RiboGreen), with an average of 80.5% and an RSD of 1.2%. These findings demonstrate good concordance between chromatographic and dye-based approaches under conditions of relatively high encapsulation and low free RNA content.
| Figure 2. Encapsulation efficiency results. |
|---|
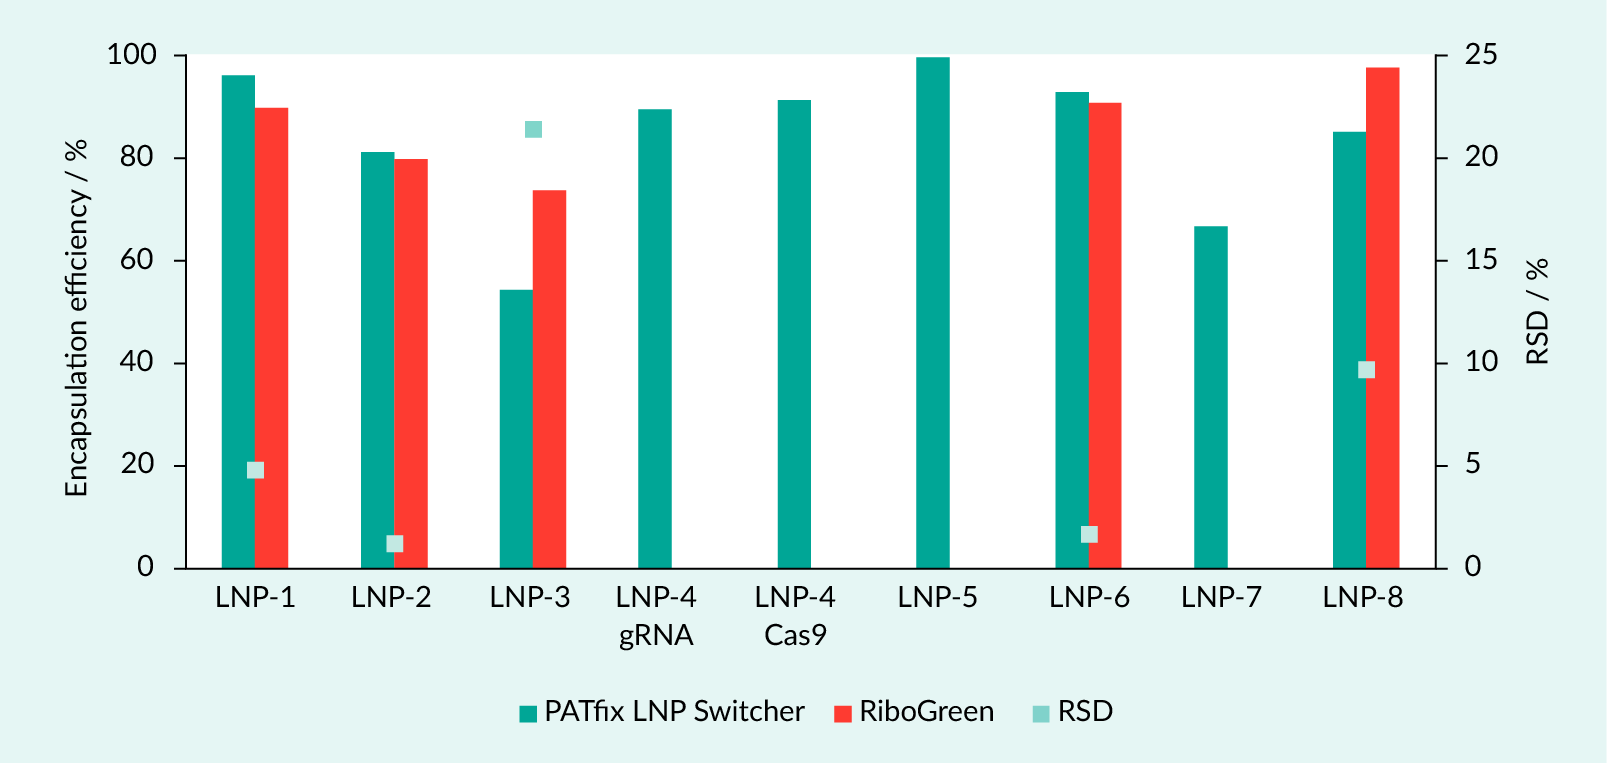 |
A more pronounced divergence was observed for LNP-3, which was formulated with 30% free mRNA. Here, the Switcher method reported an encapsulation efficiency of 54%, whereas RiboGreen yielded 74%, resulting in a high inter-method RSD of 21.5%. This pattern suggests that RiboGreen tends to overestimate encapsulation efficiency in formulations deliberately containing substantial free RNA, likely because discrimination between free and encapsulated RNA relies on complete, selective disruption of LNPs and accurate subtraction of the free fraction.
For other formulations, only the Switcher method was applied, enabling encapsulation efficiency determination across diverse cargo types. High efficiencies were observed for several mRNA formulations (e.g., LNP-5: 100%; LNP-6: 93%), and the method also supported separate quantification of multiple cargoes in LNP-4 (90% for gRNA and 92% for Cas9 mRNA). Non-mRNA formulations showed greater encapsulation variability (LNP-7 ASO: 67%; LNP-8 siRNA: 85%). Where both methods were available (e.g., LNP-6, LNP-8), the agreement remained acceptable (RSDs of 1.7% and 9.7%, respectively), but overall, the data underscore the higher specificity and cargo-resolved capability of the PATfix LNP Switcher compared with the bulk RiboGreen assay for encapsulation efficiency assessment.
Particle analysis
Particle size and heterogeneity of the eight LNP formulations were assessed using three orthogonal approaches: batch DLS (VascoKIN), FFF–UV–MALS–DLS-RI (Wyatt, Figure 3 presented below), and PATfix LNP Switcher.
| Figure 3. FFF-UV-MALS-DLS-RI results of LNP-1, with fractograms of radius of gyration (Rg, nm) on the left, hydrodynamic radius (Rh, nm) in the middle, and Burchard-Stockmayer Plot on the right. |
|---|
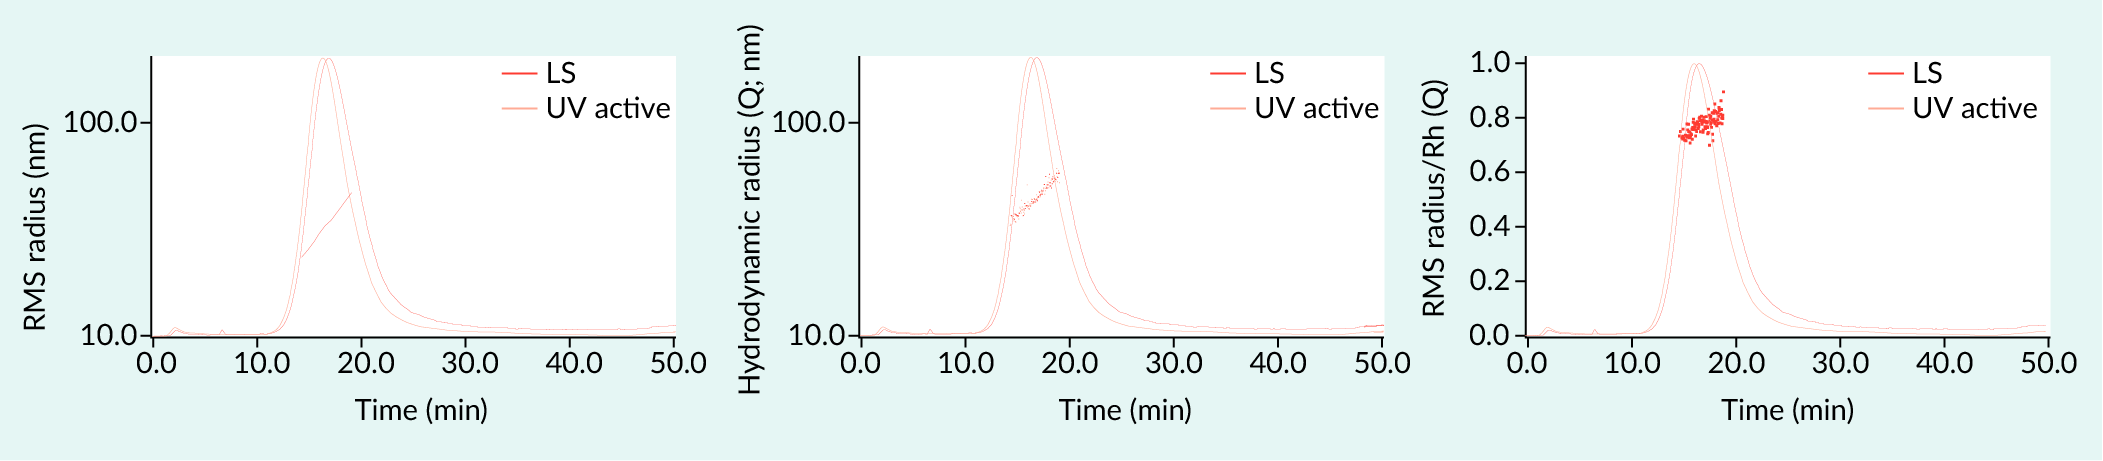 |
Overall, the three methods yielded a coherent picture of particle dimensions (results in Table 3) while highlighting formulationdependent differences and methodspecific sensitivities.
| Table 3. Particle analysis. | |||||||
|---|---|---|---|---|---|---|---|
| Sample | DLS, VascoKIN | FFF-UV-MALS-DLS-RI, Wyatt | LNP Switcher | ||||
| Z-AVG, Rh (nm) | PdI (a.u.) | Rg (nm) | Rh (nm) | Recovery (%) | Particle conc. (particle/mL) | Rg (nm) | |
| LNP-1 | 98 | 0.1 | 71 | 91 | 100 | 5.98 × 10¹² | 60 |
| LNP-2 | 114 | 0.13 | 75 | 95 | 100 | 4.04 × 10¹² | 62 |
| LNP-3 | 96 | 0.06 | 71 | 92 | 100 | 3.41 × 10¹² | 57 |
| LNP-4 | 92 | 0.17 | 91 | 121 | 100 | 1.62 × 10¹¹ | 78 |
| LNP-5 | 179 | 0.32 | 185 | 331 | 13 | 3.23 × 10⁹ | 92 |
| LNP-6 | 94 | 0.15 | 62 | 88 | NA | 1.43 × 10¹² | 71 |
| LNP-7 | 187 | 0.09 | NA | 265 | 16 | 3.29 × 10¹¹ | 77 |
| LNP-8 | 97 | 0.09 | 65 | 82 | 100 | 6.72 × 10¹³ | 76 |
| NA: Not applicable. | |||||||
For the SM-102–mRNA formulations LNP-1 to LNP-3, batch DLS reported Z-average diameters of 96–114 nm with low polydispersity indices (PDI 0.06–0.13), indicating relatively monodisperse populations. FFF–MALS–DLS produced hydrodynamic radii in the range of 91–95 nm (corresponding to hydrodynamic diameters of ~182–190 nm), and Rg of 71–75 nm. The resulting Rg/Rh ratios (>0.7) are consistent with particles larger and more structured than ideal homogeneous spheres, which is typical for LNPs. The LNP Switcher–MALS radii for these samples were 57–62 nm, corresponding to diameters of ~114–124 nm. This is in good agreement with the DLS Z-averages, considering the different weighting of the techniques (intensity-weighted DLS versus mass-weighted MALS) and the use of different size models. FFF recoveries of 100% and particle concentrations on the order of 1012 particles/mL indicate robust, well-defined populations for these formulations. For these three LNPs, the agreement across techniques supports the presence of a single dominant particle population of similar size.
LNP-4 (SM-102 with Cas9 mRNA + gRNA) showed a DLS Z-average of 92 nm but a larger FFF hydrodynamic diameter (121 nm) and a Switcher–MALS radius of 78 nm (diameter ~156 nm), suggesting that multicomponent, bulky RNA cargo leads to an overall increase in particle dimensions. While FFF recovery remained high (100%), particle concentration was one order of magnitude lower than for the simpler SM-102–mRNA LNPs (1.62 × 10¹¹ particles/mL), consistent with fewer, larger particles and/or higher mass per particle.
The most pronounced discrepancies were observed for LNP-5 and LNP-7. LNP-5 (DOTAP–Cre mRNA) showed a large Z-average (179 nm, PDI 0.32), indicating substantial heterogeneity. FFF–DLS reported a hydrodynamic radius of 331 nm (diameter ~662 nm) and Rg of 185 nm, consistent with very large or aggregated structures. In contrast, the Switcher–MALS radius was 92 nm (diameter ~184 nm), indicating that the chromatographic platform emphasizes a smaller, more defined subpopulation, whereas batch and FFF-DLS are strongly influenced by large, highly scattering species. This is consistent with the low FFF recovery (13%) and reduced particle concentration (3.23 × 10⁹ particles/mL), pointing to poor colloidal stability and/or losses during fractionation. LNP-7 (CKK-E12–ASO) also showed large sizes (DLS Z-average 187 nm, FFF hydrodynamic radius 265 nm) but a notably smaller MALS radius on the Switcher (63 nm), suggesting a broad size distribution with a smaller primary population and larger aggregates that dominate the scattering in batch and FFF-DLS.
LNP-6 (ZA3-Ep10-Cre mRNA) and LNP-8 (246-C10-siRNA) showed intermediate behavior. DLS Z-averages were 94–97 nm, with PdI values of 0.09–0.15. FFF–DLS hydrodynamic diameters (82–88 nm) and Switcher–MALS radii (71–76 nm; diameters ~142–152 nm) were broadly consistent with compact, relatively monodisperse particles. LNP-8 presented the highest particle concentration (6.72 × 10¹³ particles/mL) and full FFF recovery (100%), supporting a robust, highly dispersed siRNA LNP formulation.
In summary, the combined data demonstrate that SM-102-based mRNA LNPs form relatively uniform particles with consistent size across techniques, whereas alternative lipids (DOTAP, CKK-E12, ZA3-Ep10) lead to broader distributions, larger apparent sizes, and lower recoveries. That is due to the non-specific interactions between differently charged lipids, as mentioned previously; thus, particles are either not detected at all or the structure is disturbed, which warrants further optimization and is the next step. Additionally, there is a difference in the amount of sample required for analysis. Monolithic chromatography inherently concentrates particles due to a bind and elute mode on the OH column, while FFF dilutes the sample due to diffusion of different subpopulations. This is an important difference worth noting when choosing a technique for analyzing different nanoparticles. Orthogonal comparison of batch DLS, FFF–MALS–DLS, and Switcher–MALS is therefore critical for a nuanced assessment of LNP size, heterogeneity, and formulation quality.
Payload integrity
Payload integrity, presented in Table 4, was evaluated exclusively using the PATfix LNP Switcher platform, which enabled chromatographic separation and quantitative assessment of intact RNA, fragmented RNA, and nucleic acid–lipid adducts within each LNP formulation. This approach provided a detailed view of degradation patterns and interaction states for both encapsulated and free nucleic acids.
| Table 4. Payload integrity. | ||||
|---|---|---|---|---|
| Sample | Type of RNA | % Fragmentation encapsulated RNA | % Fragmentation free RNA | % Nucleic acid-lipid adducts |
| LNP-1 | mRNA | 14 | 17 | 31 |
| LNP-2 | mRNA | 14 | 21 | 30 |
| LNP-3 | mRNA | 14 | 19 | 30 |
| LNP-4 | gRNA | / | / | 43 |
| Cas9 | / | / | 43 | |
| LNP-5 | mRNA | / | / | / |
| LNP-6 | mRNA | 9 | 15 | 38 |
| LNP-7 | ASO | / | / | 10 |
| LNP-8 | siRNA | 22 | 34 | 24 |
For the SM-102–mRNA formulations (LNP-1 to LNP-3), encapsulated mRNA fragmentation remained in a narrow range (14%), whereas fragmentation of free mRNA was consistently higher (17–21%). This difference indicates that encapsulation provides a measurable protective effect against degradation, with free RNA being more susceptible to fragmentation under the same conditions. Across these three samples, the proportion of nucleic acid–lipid adducts, calculated as a portion of encapsulated RNA, was relatively consistent (30–31%), suggesting a stable interaction mode between SM-102 and mRNA that is largely unaffected by the proportion of free RNA in the formulation.
LNP-6 (ZA3-Ep10-Cre mRNA) showed lower fragmentation of encapsulated RNA (9%) but still elevated fragmentation of free RNA (15%), again highlighting the protective role of the LNP environment. Notably, this formulation exhibited a higher level of nucleic acid–lipid adducts (38%) compared with SM-102–mRNA LNPs, suggesting a stronger or more prevalent association between ZA3-Ep10 and its mRNA cargo.
In contrast, LNP-8 (246-C10-siRNA) displayed the highest fragmentation levels among the formulations for which the integrity of both encapsulated and free RNA could be quantified. Encapsulated siRNA showed 22% fragmentation, while the free siRNA fraction reached 34%. The fraction of nucleic acid–lipid adducts in this sample (24%) was lower than in SM-102–mRNA and ZA3-Ep10-mRNA LNPs, which may indicate weaker or less extensive lipid–siRNA interactions and could contribute to the higher fragmentation observed.
For other cargos, only the nucleic acid–lipid adduct fraction could be robustly quantified. LNP-4 (SM-102 with Cas9 mRNA and gRNA) showed a high proportion of adducts (43%), suggesting strong or abundant nucleic acid–lipid complexes in this multicomponent system. LNP-7 (CKK-E12-ASO) exhibited a lower proportion of adducts (10%), consistent with a different interaction pattern between the lipid and short oligonucleotide cargo. No reliable integrity metrics were obtained for LNP-5 under the tested conditions.
Overall, these results demonstrate that payload integrity is strongly influenced by both the lipid and nucleic acid type. Encapsulation consistently reduces fragmentation relative to free RNA, but the extent of protection and the prevalence of nucleic acid–lipid adducts vary substantially across formulations. The PATfix LNP Switcher method thus provides critical, cargoresolved insight into degradation and interaction states that are not accessible with bulk assays.
Critical quality attributes addressed by emerging analytical methods
Table 5 lists the current analytical methods recommended by the USP [9]. The last column indicates where the emerging analytical platform presented in this article can be integrated into the existing release testing for quality control of mRNA-LNP drug products. Emerging methods like the LNP Switcher (HIC-MALS-IP-RP-LC-UV) can significantly streamline testing by combining multiple methods into a single one, reducing the number of release methods from six to one, as presented in Table 5. While this article does not cover lipid identification and quantification, these are future enhancements planned for such a platform.
| Table 5. Characterization and release testing of mRNA drug products. | |||
|---|---|---|---|
| Quality | Attribute | Current suggested method | Emerging new methods described in this article |
| Identity | RNA identification | Sanger Sequencing PCR | / |
| Identity of lipids | RP-LC-CAD | Future direction with CAD/ELSD: LNP Switcher (HIC-MALS-IP-RP-LC-UV) | |
| Content | RNA concentration/RNA encapsulation efficiency | RiboGreen | LNP Switcher (HIC-MALS-IP-RP-LC-UV) |
| Lipid content | RP-LC-CAD | Future direction of CAD/ELSD: LNP Switcher (HIC-MALS-IP-RP-LC-UV) | |
| Integrity | LNP size and polydispersity | DLS | FFF–UV–MALS–DLS-RI; LNP Switcher (HIC-MALS-IP-RP-LC-UV) |
| RNA size and integrity | CGE | LNP Switcher (HIC-MALS-IP-RP-LC-UV) | |
| Purity | DP related impurities – aggregate quantitation | SEC-LC | / |
| DP related impurities – percentage of fragmented mRNA | IP-RP-LC | LNP Switcher (HIC-MALS-IP-RP-LC-UV) | |
| Potency | Expression | Cell-based assay | / |
| Safety | Endotoxin | USP <85> | / |
| Sterility | USP <71> | / | |
| Other | Appearance | USP <790> | / |
| Residual solvents | USP <467> | / | |
| Osmolality | USP <785> | / | |
| Subvisible particles | USP <787> | / | |
| Extractable volume | USP <1> | / | |
| Container closure integrity | USP <1207> | / | |
| pH | USP <791> | / | |
Data from [9]. | |||
Emerging platforms like the FFF-UV-MALS-DLS-RI are comprehensive, robust methods that can replace current limiting methods, such as DLS. More importantly, they offer additional quality attributes that can describe drug products in much greater detail and can lead to more reproducible and efficacious drug products, such as size distribution, RNA loading, and particle morphology. Although analytical methods for important quality aspects are already implemented in the European, USA and Chinese [13] Pharmacopoeia, discussions to identify methods that are adequate and comprehensive are still ongoing. The LNP Switcher platform described above can provide additional information on adduct impurity formation, which has been shown to be crucial to particle stability and activity.
Scalability: chromatographic purification of LNPs
Methods developed at the analytical scale can be easily transferred to larger scales with minor process optimization. Real-time monitoring of CIMmultus purification can be performed using a range of in-line detectors, including UV absorbance, light scattering, and conductivity. As shown in the representative LNP chromatogram (Figure 4A), a negligible UV signal is observed during sample loading, while a pronounced peak appears during elution, indicating efficient LNP capture and subsequent recovery from the OH column.
NTA analysis revealed a sharp particle size distribution peak (Figure 4B and D), indicating a homogeneous LNP population following purification and suggesting the absence of aggregation under the applied purification conditions. The gentle nature of the process was further confirmed by encapsulation efficiency measurements obtained using the PATfix LNP Switcher, which showed that more than 99% of mRNA remained encapsulated throughout purification. Formation of mRNA–lipid adducts remained comparable to other LNP formulations, with less than 25% adduct formation observed. LNP recovery of 88% was calculated based on mRNA concentration measurements obtained using the PATfix LNP Switcher, excluding non-encapsulated mRNA (Figure 4C). Furthermore, the luciferase assay confirmed that the purification process yielded highly active LNP formulations (Figure 4D).
| Figure 4. Chromatographic LNP purification. |
|---|
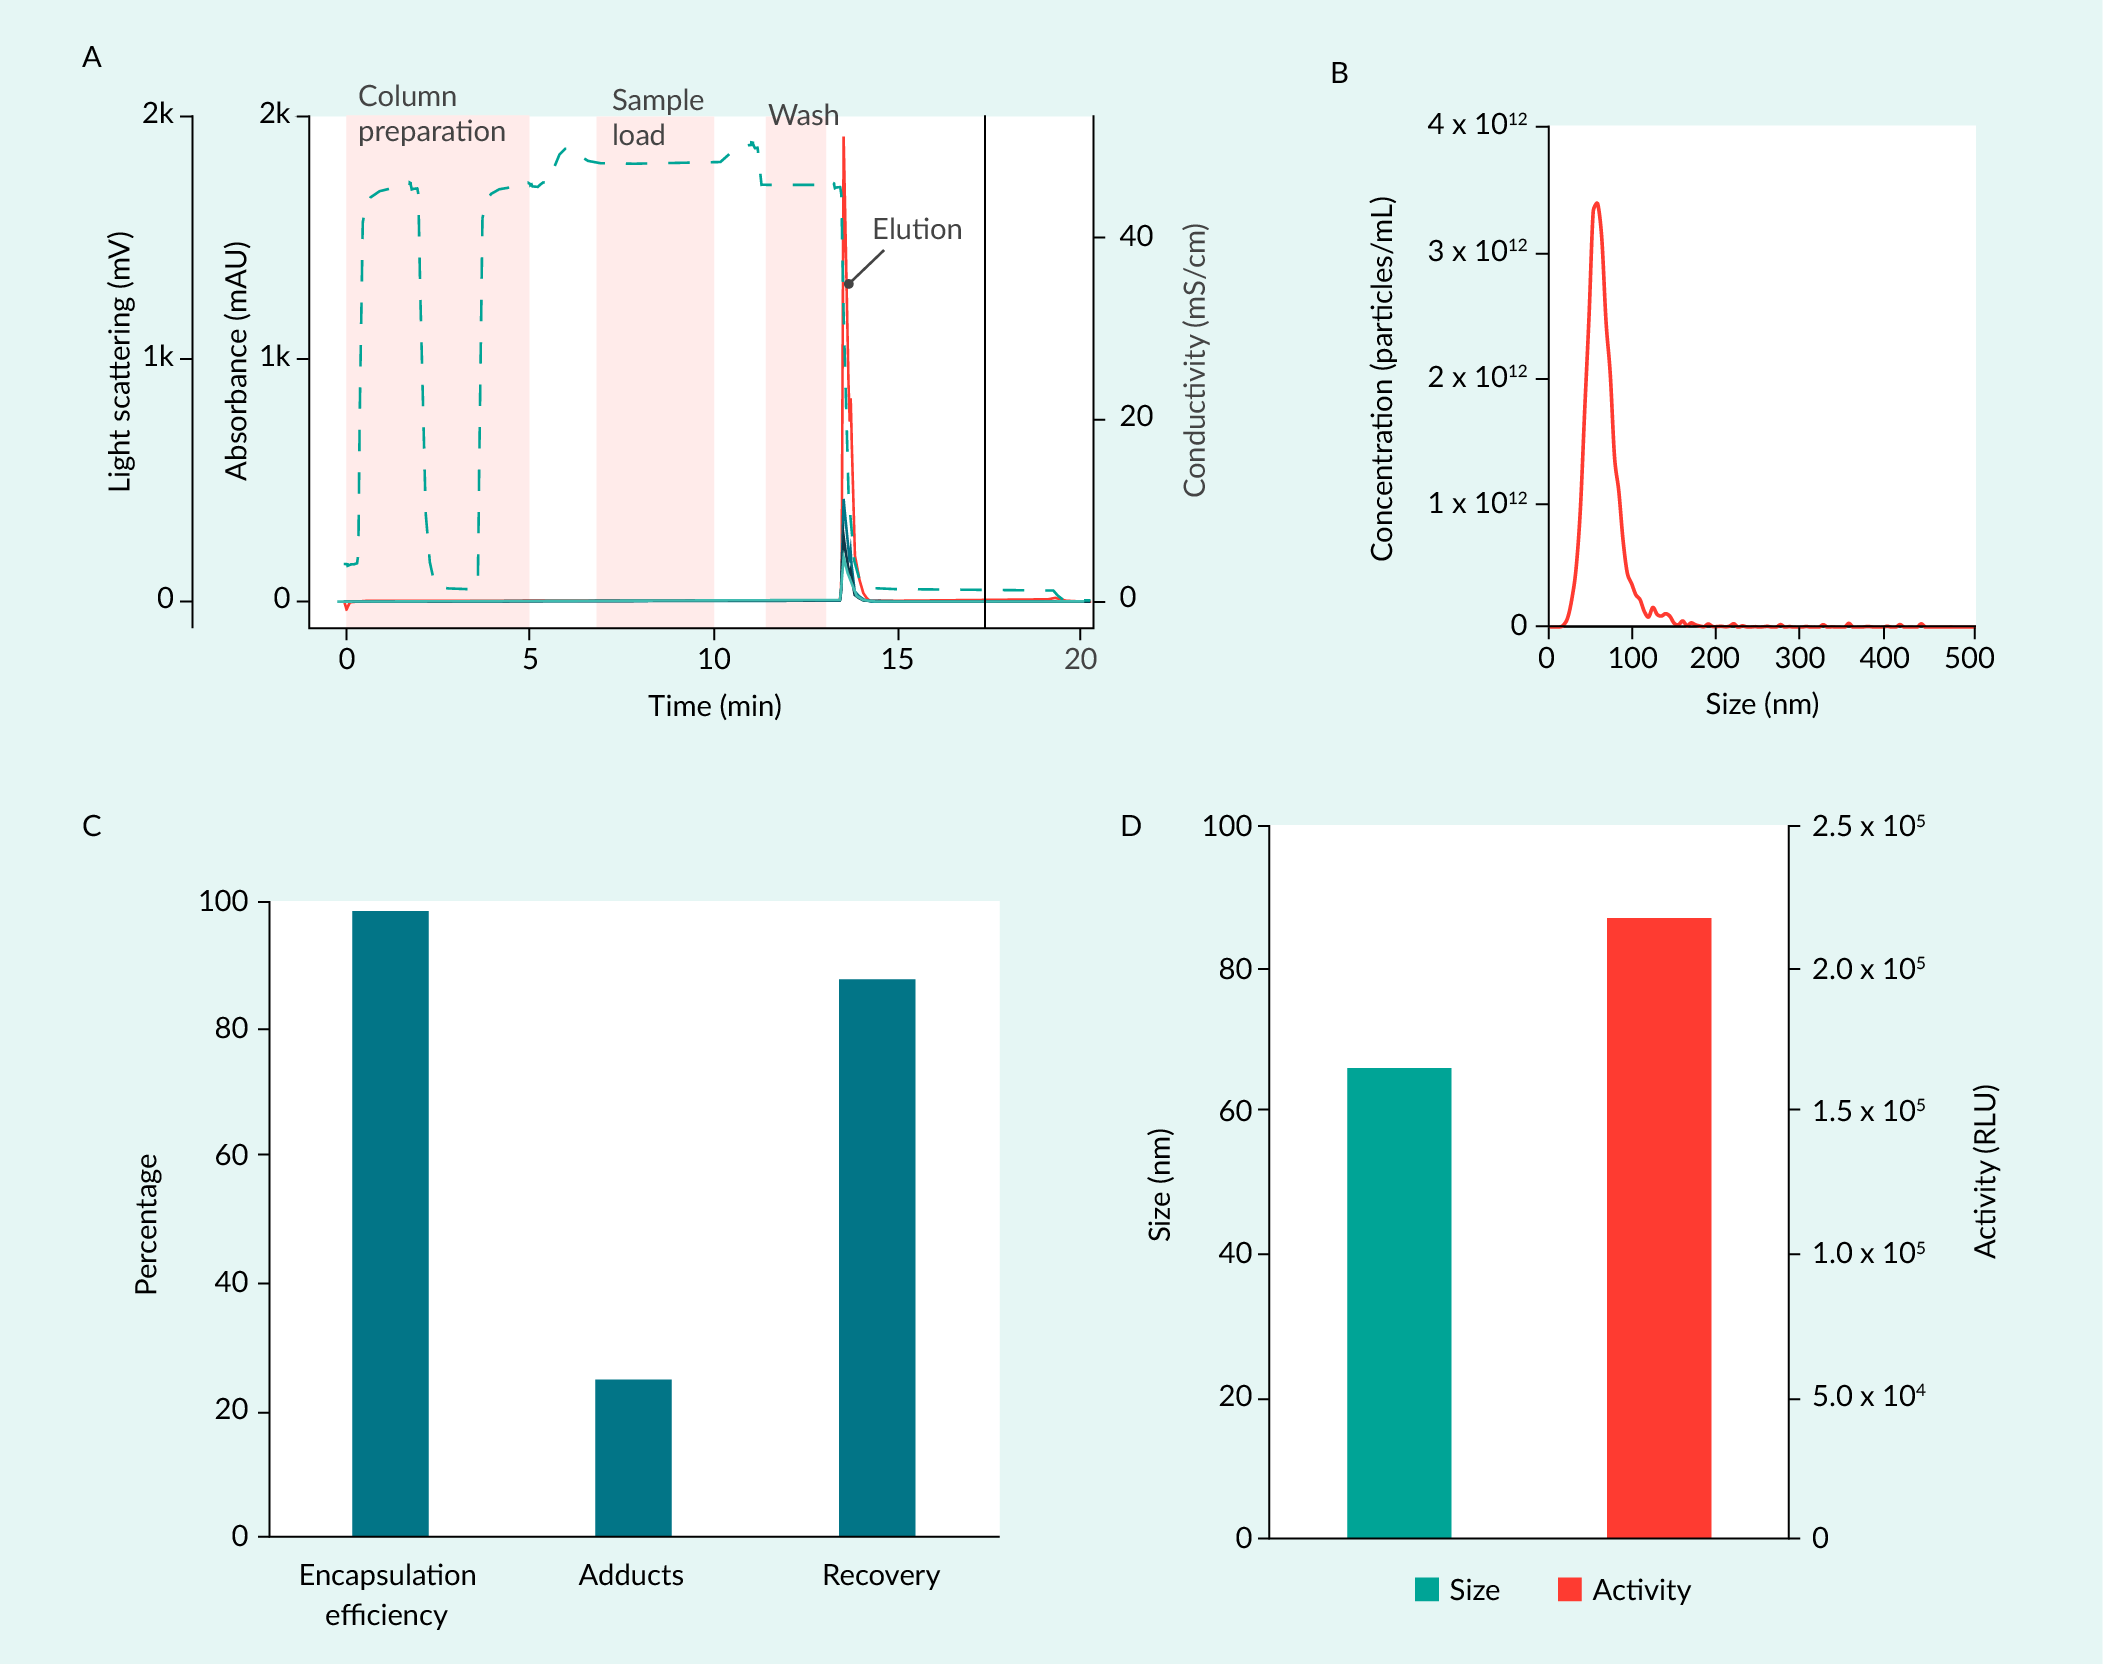 |
| A: Representative chromatogram using 1 mL CIMmultus column; B: NTA measurement; C: Results from PATfix LNP Switcher; D: Size and activity of LNPs as determined by NTA and luciferase assay. |
Collectively, these results demonstrate that purification using the CIMmultus OH column provides a gentle and efficient approach for obtaining homogeneous, high-quality LNP samples while preserving particle integrity and minimizing product loss.
Conclusions
Across all analytical dimensions, the PATfix LNP Switcher provided a highly resolved, cargo-specific view of LNP quality that complemented and expanded beyond conventional assays.
For total RNA quantification and encapsulation efficiency, Switcher results were generally consistent with RiboGreen and formulation expectations in simple SM-102–mRNA systems with low free RNA, validating both approaches in this regime. However, in formulations with high levels of free RNA or complex cargo, RiboGreen systematically overestimated total RNA and encapsulation, whereas the chromatographic method remained consistent with expected loads and clearly discriminated among multiple RNA species within a single LNP.
Orthogonal particle analysis showed that SM-102–mRNA LNPs form relatively uniform particles with good consistency across batch DLS, FFF–MALS–DLS, and Switcher–MALS, while formulations based on alternative lipids or larger/shorter cargos (DOTAP, CKK-E12, ZA3-Ep10, Cas9, ASO, siRNA) exhibited broader size distributions, larger apparent radii, lower recoveries, and greater susceptibility to aggregation.
Formulations with a permanently charged cationic lipid (LNP-5, DOTAP) stand out as those that most need further optimization and development of analytical methods. Their very strong positive charge leads to strong complexation with the mRNA. Under storage conditions of ionizable LNPs, the ionizable lipid is mostly deprotonated, and the overall charge of the LNP is neutralized. The strong positive charge of the cationic lipid also increases its non-specific interactions with solid-state surfaces. FFF utilizes a negatively charged cellulose membrane, which limits its compatibility with permanently cationic lipids. Further material optimization may help reduce the negative charge of the membranes. Monolithic chromatography offers various column chemistries that can be selected and used to further develop this method, making it more appropriate for a broader range of samples, including permanently cationic formulations.
Payload integrity data further demonstrated that encapsulation consistently reduces fragmentation compared with free nucleic acid, but the degree of protection and the prevalence of nucleic acid–lipid adducts are strongly lipid- and cargo-dependent.
Collectively, these results support three key conclusions: (1) the PATfix LNP Switcher enables cargo-resolved quantification and integrity assessment that is not achievable with bulk assays; (2) dye-based quantification using RiboGreen can exhibit systematic bias in formulations containing high fractions of free RNA and/or complex RNA mixtures; and (3) orthogonal analytical workflows are essential for robust characterization of complex LNP systems, particularly as formulations diversify in lipid chemistry and payload composition. Together, the PATfix LNP Switcher as a robust multi-parameter platform for simultaneous assessment of RNA quantity, encapsulation, particle properties, and payload integrity, complementing established assays and supporting both process development and scalable manufacturing. Leveraging this analytical framework, we established an LNP purification process that efficiently removes in-process impurities and solvents while preserving the encapsulated payload's quality and particle integrity. Ultimately, this approach supports the production of safe, effective LNP particles suitable for clinical and commercial applications.
References
1. Rosenblum D, Gutkin A, Kedmi R, et al. CRISPR-Cas9 genome editing using targeted lipid nanoparticles for cancer therapy. Sci. Adv. 2020; 6(47), eabc9450. Crossref
2. Hou X, Zaks T, Langer R, Dong Y. Lipid nanoparticles for mRNA delivery. Nat. Rev. Mater. 2021; 6(12), 1078–1094. Crossref
3. Kon E, Elia U, Peer D. Principles for designing an optimal mRNA lipid nanoparticle vaccine. Curr. Opin. Biotechnol. 2022; 73, 329–336. Crossref
4. Cullis PR, Felgner PL. The 60-year evolution of lipid nanoparticles for nucleic acid delivery. Nat. Rev. Drug Discov. 2024; 23(9), 709–722. Crossref
5. Pavlin N, Bavčar M, Kovačič T, et al. Analysis of lipid nanoparticles using two-dimensional chromatography: simultaneous determination of encapsulation efficiency, nucleic acid integrity, and size of LNP formulations. J. Chromatogr. B Analyt. Technol. Biomed. Life Sci. 2025; 1265, 124751. Crossref
6. Packer M, Gyawali D, Yerabolu R, Schariter J, White P. A novel mechanism for the loss of mRNA activity in lipid nanoparticle delivery systems. Nat. Commun. 2021; 12(1), 6777. Crossref
7. Hashiba K, Taguchi M, Sakamoto S, et al. Overcoming thermostability challenges in mRNA–lipid nanoparticle systems with piperidine-based ionizable lipids. Commun. Biol. 2024, 7 (1), 556. Crossref
8. Kovačič T, Haas H, Stotsky-Oterin L, Štrancar A, Bren U, Peer D. The impact of chemical reactivity on the quality and stability of RNA–LNP pharmaceuticals. Nat. Rev. Chem. 2025; 9(11), 790–802. Crossref
9. US Pharmacopeia. USP mRNA Vaccine Chapter. 2023; USP. Link
10. Parot J, Mehn D, Jankevics H, et al. Quality assessment of LNP-RNA therapeutics with orthogonal analytical techniques. J. Control. Release 2024; 367, 385–401. Crossref
11. Kolb B, Graewert M, Drexel R, et al. Advanced quality and comparability assessment of mRNA-loaded lipid nanoparticles: absolute size distribution profiles and structure from AF4-coupled light and X-ray scattering measurements. Anal. Chem. 2026; 98(7), 5271–5283. Crossref
12. Kovačič T, Tajnik Sbaizero M, Leban T, et al. Novel purification methods for manufacturing of complex lipid nanoparticle formulations. Presented at: AAPS PharmSci360. San Antonio, TX, USA. Nov 2025. Link
13. Qiu, X. Introduction to the Technical Requirements in the Guidelines on Prophylactic COVID-19 mRNA Vaccines. In: CMC Strategy Forum China; Taizhou (Jiangsu), China, 2022. Link
Affiliations
Sergeja Lebar, Tristan Kovačič, Ana Ferjančič Budihna, Nejc Pavlin, Mojca Bavčar, Tjaša Leban, Mojca Tajnik Sbaizero, and Andreja Gramc Livk, Sartorius BIA Separations, Ajdovščina, Slovenia
Jeremie Parot, Alicja Molska, and Sven Even Borgos, SINTEF Industry, Department of Biotechnology and Nanomedicine, Trondheim, Norway
Authorship & conflict of interest
Contributions: The named authors take responsibility for the integrity of the work as a whole, and have given their approval for this version to be published.
Acknowledgements: None.
Disclosure and potential conflicts of interest: The Sartorius BIA Separations authors received no financial support for the research, authorship, and/or publication of this article.
Funding declaration: SINTEF would like to acknowledge funding from the European Innovation Council through the project Nano-Engine (EIC Pathfinder Open, Grant Agreement no. 101098944), and from the Dutch Research Council (NWO) through the project Nanospresso-NL (NWA-ORC, Grant Agreement no. NWA.1389.20.096).
AI process statement: No AI tools were used in the preparation of this article.
Article & copyright information
Copyright: Published by Cell & Gene Therapy Insights under Creative Commons License Deed CC BY NC ND 4.0 which allows anyone to copy, distribute, and transmit the article provided it is properly attributed in the manner specified below. No commercial use without permission.
Attribution: Copyright © 2026 Sartorius BIA Separations. Published by Cell & Gene Therapy Insights under Creative Commons License Deed CC BY NC ND 4.0.
Article source: This article was written by the named authors and reviewed by BioInsights' Editorial team to ensure clarity, scientific accuracy, and alignment with BioInsights' editorial standards. The article was externally peer reviewed.
Submitted for peer review: Jun 22, 2026.
Revised manuscript received: Jul 31, 2026.
Publication date: Sep 3, 2026.