The necessity of automated manufacture for cell-based immunotherapies: a cost-based analysis
Cell & Gene Therapy Insights 2020; 6(5), 673–690
10.18609/cgti.2020.071
Automation adoption is a fundamental requirement to de-risk manufacturing processes and support sustainable commercial realization of cell and gene therapies. In this study, we examined cost and productivity sensitivities to increasing automation for the manufacture of cell-based immunotherapies. Firstly, we stratified automation adoption into four strategic levels (Manual, Bolt-together, Integrated and High-throughput) and adapted each to support the manufacture of an exemplar CAR-T immunotherapy. Then, using an internally developed modelling tool, we demonstrated automation adoption at the Bolt-together level reduced the Cost of Manufacture (23%) to Manual processing with limited further reductions seen as a function of increasing automation levels (max 30%). However, more significantly, we illustrated how automation adoption delivers increased throughputs (batches/yr) proportional to automation level in the example modelled, when maintaining facility footprint and constraints. This study highlights the value of employing modelling tools to strengthen early-stage development activities with respect to the assessment of automation adoption strategies to support commercial realization and confirms the requirement for automation if cell and gene therapies are going to realize their full potential at industrial scale.
Introduction
Cell and gene therapies (CGTs) are showing immense promise to transform the management of chronic disease, from diffuse cancers to monogenetic disorders and eye disease. There are currently 14 licensed products in total being actively reimbursed within the US (9) and EU (9) respectively – with the ability to supply the market, a core component considered during licensure. The immune-oncology sector has dominated recent advances in the field, with gene modified Chimeric Antigen Receptor (CAR) T-cell immunotherapies demonstrating durable responses in up to 80% of complex liquid tumor patients [1]Lee DW, Kochenderfer JN, Stetler-Stevenson M et al. T cells expressing CD19 chimeric antigen receptors for acute lymphoblastic leukaemia in children and young adults: a phase 1 dose-escalation trial. The Lancet 2015; 385(9967): 517–28., [2]Maude SL, Frey N, Shaw PA et al. Chimeric Antigen Receptor T Cells for Sustained Remissions in Leukemia. N. Eng. J. Med. 2014; 371(16): 1507–17., [3]Maus MV, Grupp SA, Porter DL et al. Antibody-modified T cells: CARs take the front seat for hematologic malignancies. Blood 2014; 123(17): 2625., [4]Schuster SJ, Bishop MR, MD, Tam CS et al. Primary Analysis of Juliet: A Global, Pivotal, Phase 2 Trial of CTL019 in Adult Patients with Relapsed or Refractory Diffuse Large B-Cell Lymphoma. Blood 2017; 130(Suppl 1): 577., [5]Borchmann P, Jäger U, McGuirk JP et al. An updated analysis of JULIET, a global pivotal Phase 2 trial of tisagenlecleucel in adult patients with relapsed or refractory (r/r) diffuse large b-cell lymphoma (DLBCL). In: The 23rd Congress of EHA. 2018. Stockholm, Sweden.. FDA and EMA awarding of marketing authorization to Novartis’s Kymriah® and Kite’s Yescarta® in 2017 and 2018 respectively, swiftly followed by high profile acquisitions (Gilead’s $12 billion for Kite and Celgene’s $9 billion for Juno Therapeutics), signals commercial commitment to CGTs. Furthermore, the CGT industry attracted greater than $16 billion dollars in financing over the first 3 quarters of 2019 [6]Alliance Regenerative Medicine. Quarterly Regenerative Medicine Sector Report – Q3 2019: https://alliancerm.org/publication/q3-2019-data-report/. However, positive clinical data and the receipt of marketing authorization do not guarantee commercial success. Health payer reimbursement, clinical adoption, supply logistics and cost-effective robust manufacturing strategies have all been identified as key deterministic factors of commercial success [7]Jarosławski S, Toumi M. Sipuleucel-T (Provenge®) – Autopsy of an Innovative Paradigm Change in Cancer Treatment: Why a Single-Product Biotech Company Failed to Capitalize on its Breakthrough Invention. Vol. 29. 2015., [8]uniQure, uniQure announces it will not seek marketing authorization renewal for Glybera in Europe. 2017., [9]Abou-El-Enein M, Elsanhoury A, Reinke P. Overcoming Challenges Facing Advanced Therapies in the EU Market. Cell Stem Cell 2016; 19(3): 293–7.. Each of these present unique challenges, and analysis can employ different tools. Herein we apply an engineering approach to analyze the latter, where various manufacturing strategies of a CAR T-cell product are viewed considering the associated cost and capacity.
For this we need to examine the evolution of these therapies and how they move from discovery to clinical use. Novel therapies generally emerge from laboratory research environments. Early stage development benefits from flexible, manual processing strategies allowing agile exploration of new biological technologies. Ideally, therapies showing promise would then benefit from process and analytical industrialization through automation to increase potential for commercial success. However, at this stage of development funds are scarce, and industrialization investment has to compete with clinical data generation. In turn, this locks-in those flexible, manual processes which benefit discovery, with limited scalability for commercial roll-out.
CGT manufacturing process industrialization has become a specialism in itself seeding the growth of companies with appropriate capabilities. Commercial entities providing this function typically provide expert process diagnostics, analytical test development and access to automated commercial bioprocessing systems. When automating manufacturing systems, two models currently exist. Firstly, manual processing steps can be closed and automated on an individual unit operation basis. These systems can then be ‘bolted’ together. This daisy-chaining of systems support the generation of a closed end-to-end automated process, but often still requires manual intervention to transfer material between systems representative of different unit operations. Secondly, integrated solutions exist, whereby multiple unit operations are combined onto a single platform [10]Granzin M, Soltenborn S, Müller S et al. Fully automated expansion and activation of clinical-grade natural killer cells for adoptive immunotherapy. Cytotherapy 2015; 17(5): 621–32.. These reduce operator intervention and increases process consistency, however they are less flexible, and inherent process bottlenecks renders other unit operations unavailable. Finally, in-built analytical functionality is currently limited, meaning process monitoring still requires sampling for off-line analysis.
To meet the expected ‘high-throughput’ required for realizing commercial success of autologous immunotherapies, integrated processing may reflect automotive and pharma manufacture, allowing parallel processing of multiple patient therapies on a single platform. This shift from manual processing, to ‘bolt-together’ automation, to integrated solutions, and eventually to a futuristic ‘high throughput’ system, presents new commercial and quality challenges [11]Levine BL, Miskin J, Wonnacott K et al. Global Manufacturing of CAR T Cell Therapy. Mol. Ther. Meth. Clin. Dev. 2017 4(Suppl. C): 92–101. that require addressing prior to health sector adoption [12]Brindley DA, Smith JA, Reeve B et al. Automation of CAR-T Cell Adoptive Immunotherapy Bioprocessing: Technology Opportunities to Debottleneck Manufacturing. BioProcess Int. 2016; 14(4): 22–31.. Challenges already recognized include: development of enabling technologies to allow safe manufacturing stream parallelization; incorporation of process analytical technologies (PAT) for monitoring and control; shifting from scheduled (stepwise recipes) to adaptive (feedback control) processing. These developments will enable scalability, and are a prominent discussion point within the industry [13]McCall. Rapporteurs’ Report. in Phacilitate Automation – Special Interest Group. 2017. Edinburgh. when contemplating the vision for idealized ‘high-throughput’ systems of the future.
When considering the therapy reimbursement cost, investor-funded development costs need to be recovered as well as the ongoing manufacturing cost of goods (CoGs). These are then viewed in-line with the targeted disease prevalence (rare versus common) which means that a one-solution-fits-all strategy to automation adoption will not be appropriate. At this point CoGs can be affected through process industrialization, and therefore the art of CoGs modelling should direct automation planning.
Current modelling strategies for determining the manufacturing CoGs fall into two distinct categories. The first utilizes a goal seeking orientated approach, identifying the most cost-effective solution in an ‘unconstrained’ environment, by mass balancing different combinations of bioprocessing technology solutions [14–16]. The second, constrains the manufacturing facility design or the process toolchain and seeks to maximize/optimize a pre-defined measure of success, such as cost or throughput [17]Lopes AG, Sinclair A, Frohlich B. Cost Analysis of Cell Therapy Manufacture: Autologous Cell Therapies, Part 1. Bioprocess Int. 2018; 16(3): 3–9., [18]Lopes AG, Sinclair A, Frohlich B. Cost Analysis of Cell Therapy Manufacture Autologous Cell Therapies, Part 2. Bioprocess Int. 2018; 16(4): 12–9.. Technically, whilst both modelling strategies can provide valuable insight, gaps exist, especially around the oversight of the assumptions and constraints. This makes it challenging to compare model outputs from different authors to support comparative analysis. Furthermore, from a practical perspective, companies rarely have the capital to build facilities from the outset that are capable of meeting projected demands for different stages of the development or commercialization pathway. This coupled with the high risk of investment early in the development program, when supporting clinical data is yet to be realized, means this second strategy for CoGs modelling has the potential to be of greater value in understanding how to maximize utility of collaborations with CMOs, or of leased manufacturing space, where the facility infrastructure is already in place.
The aim of this study is to apply different automation strategies to CGT Catapult’s exemplar CAR-T cell therapy process to interrogate their potential to optimize Cost of Manufacture (CoM) and manufacturing throughput. Manufacturing costs including suite layout, process equipment utilization, staff scheduling, and quality control/release aspects have all been considered in order to provide a comprehensive analysis with the assumptions and constraints clearly detailed. This study supports understanding of how the implementation of four different levels of automation (manual, ‘bolt-together’, integrated and a forward looking idealized ‘high-throughput’ system) may impact the scalability of CAR-T therapy manufacture.
Materials & methods
The economics and resource utilization model applied in this study was developed using Microsoft Excel® (Microsoft Office 2016, Microsoft Corporation, WA, USA). This model was designed to evaluate the relationship between key manufacturing strategy considerations in terms of manufacturing suite footprint, throughput, labor utilization and CoM as a function of applied automation level. The model focused exclusively on what occurs within the manufacturing suite and quality control (QC) activities. As the model omits the parameters described below, cost projections as a function of automation level are described as CoM rather than CoGs.
- Preand post-manufacturing unit supply chain logistics and staffing thereof;
- Cold chain storage capacity and staffing thereof;
- Warehousing and staffing thereof;
- Quality management/assurance oversight (except for the QP);
- Commercial licenses associated with the use of reagents and equipment;
- Batch failure rates – it was assumed all batches were completed successfully;
- R&D costs during development.
Automation level definition
To stratify process automation into different categories for evaluation, an indicative structure describing four discrete levels was proposed as defined below and illustrated in Figure 1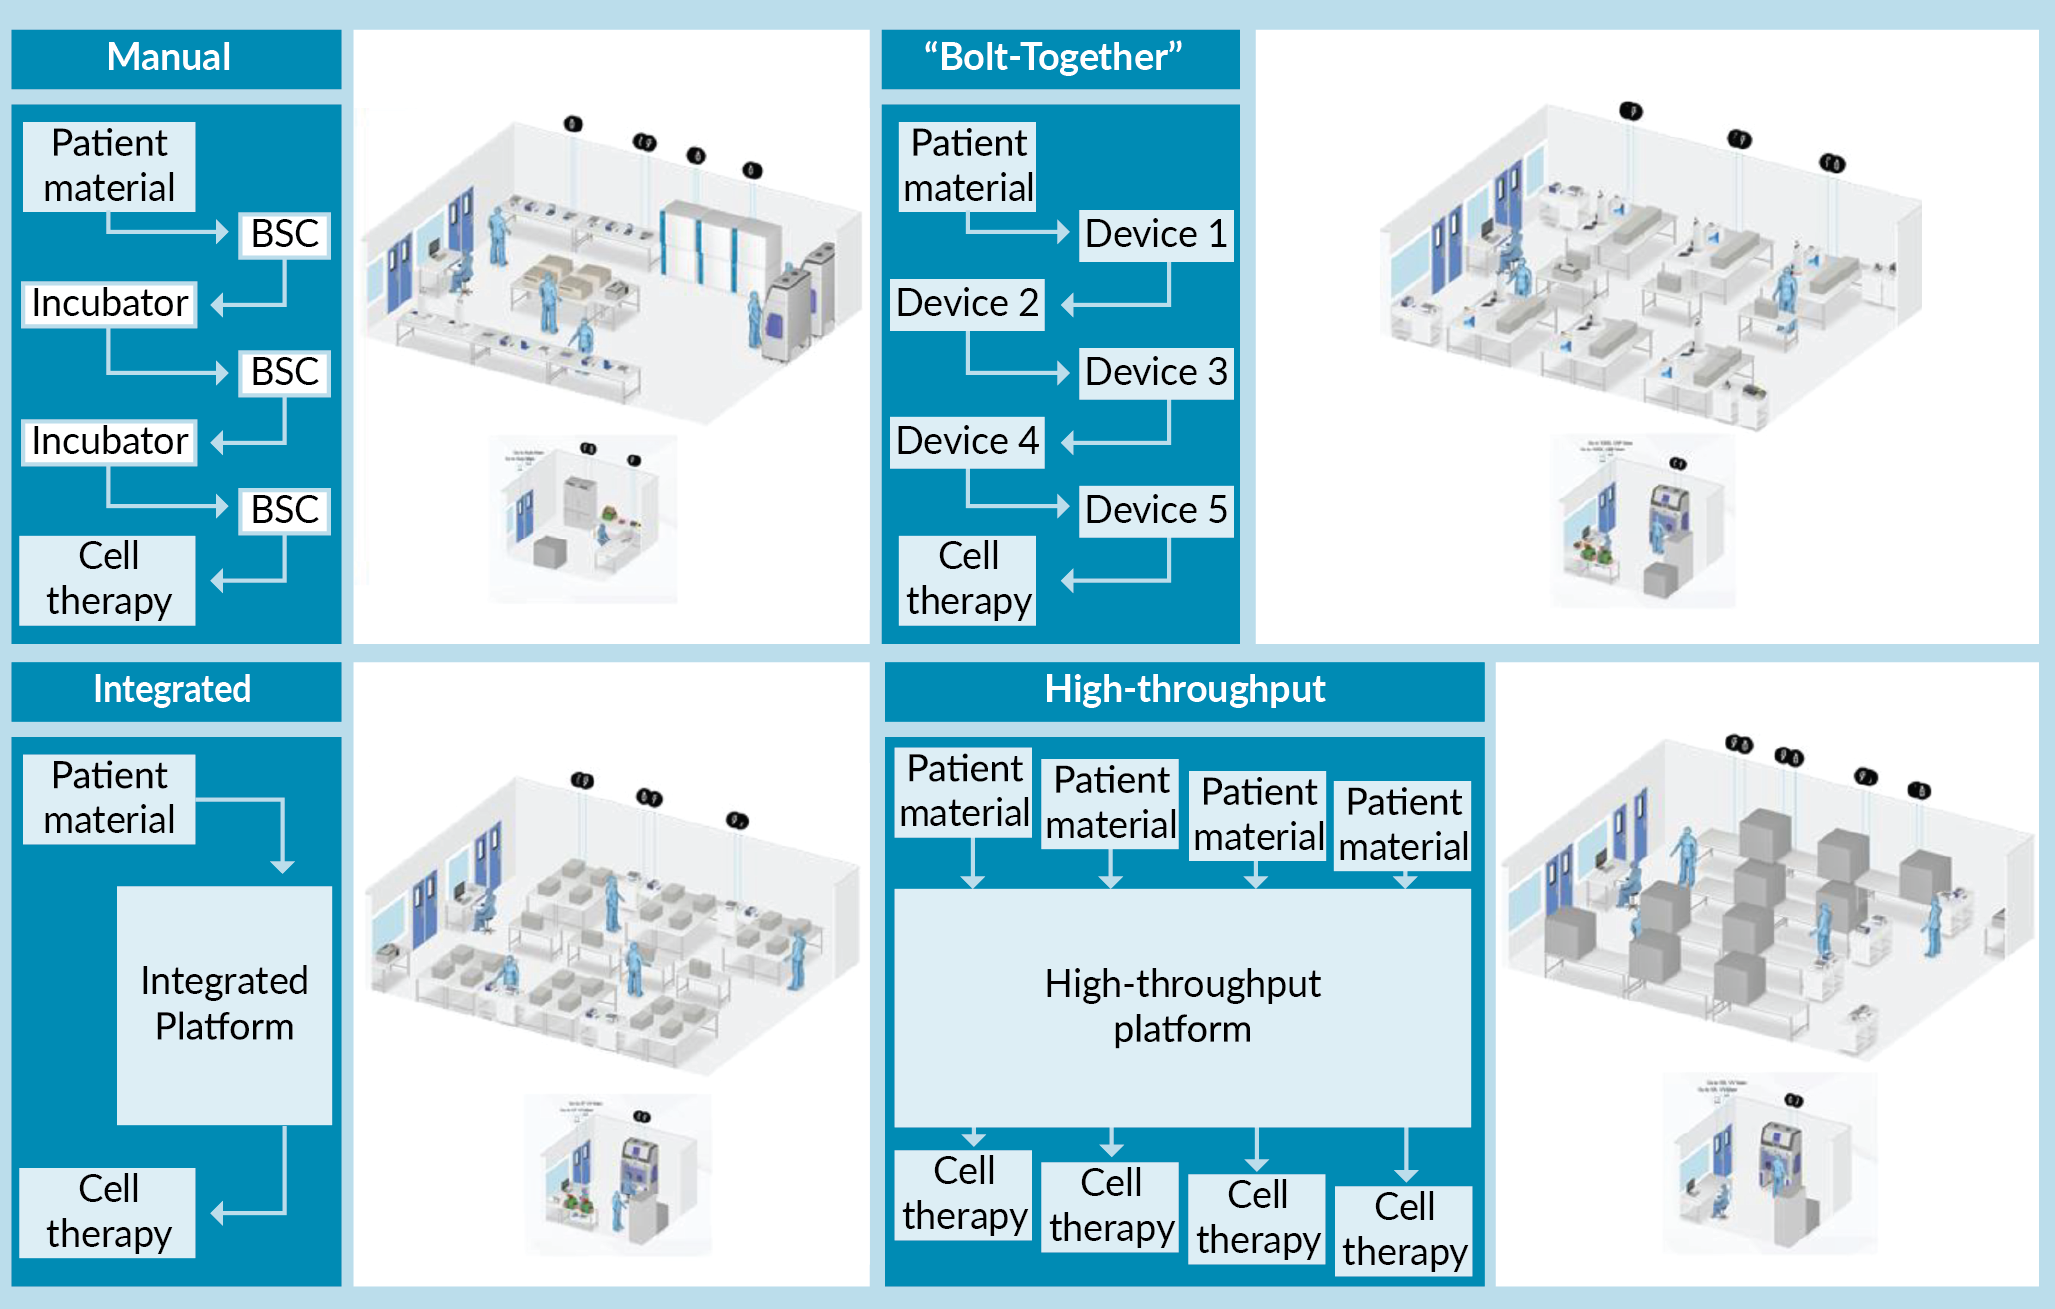
Manual
A process with a low level of automation. Most unit operations are performed utilizing conventional manual handling methods. This approach requires use of Biological Safety Cabinet (BSC) isolators to provide a Grade A processing environment for material manipulation in a Grade C background. Process material is cultured in laboratory incubators. For the exemplar CAR-T process modelled in this study, only the cell isolation processing step utilizes an automated unit operation (CliniMACs® Plus). All analytical techniques are performed off-line.
Bolt together
A process where automation is applied at the individual unit operation level. This approach still requires operator intervention to transfer material between unit operations but can be performed completely using closed processing technologies. As each automated device represents a single unit operation and is operated independently, it means that multiple devices within the same process stream can be utilized at the same time – supporting concurrent manufacture of different patient therapies (e.g., Patient A material may be processed by Device 1 whilst Patient B material is being processed by Device 2). All analytical techniques are performed off-line. Cell expansion has ‘on-line’ monitoring capability for some process parameters (pH, Dissolved Oxygen [DO]).
Integrated
A process where automation is applied across multiple unit operations in a unified manner utilizing closed processing technologies and disposable single use tubing/reactor sets. The only operator intervention during processing is to remove samples or exchange reagent reservoirs. Each integrated platform can only handle a single batch at any one time. All analytical techniques are performed off-line. Cell expansion has ‘on-line’ monitoring capability for some process parameters (pH, DO).
‘High-throughput’
A hypothetical, automated system capable of processing parallel streams of patient material utilizing closed processing technologies. The system has integrated at-line and on-line analytics (minimizing the need for operator intervention). The system takes advantage of shared functionality across the parallelized streams.
CAR-T cell process definition
A generic exemplar 7-day CAR-T immunotherapy process, capable of generating a single dose of 1 billion CD3+ cells per patient, was defined for use in this study and then adapted to the automation levels described above (Figure 2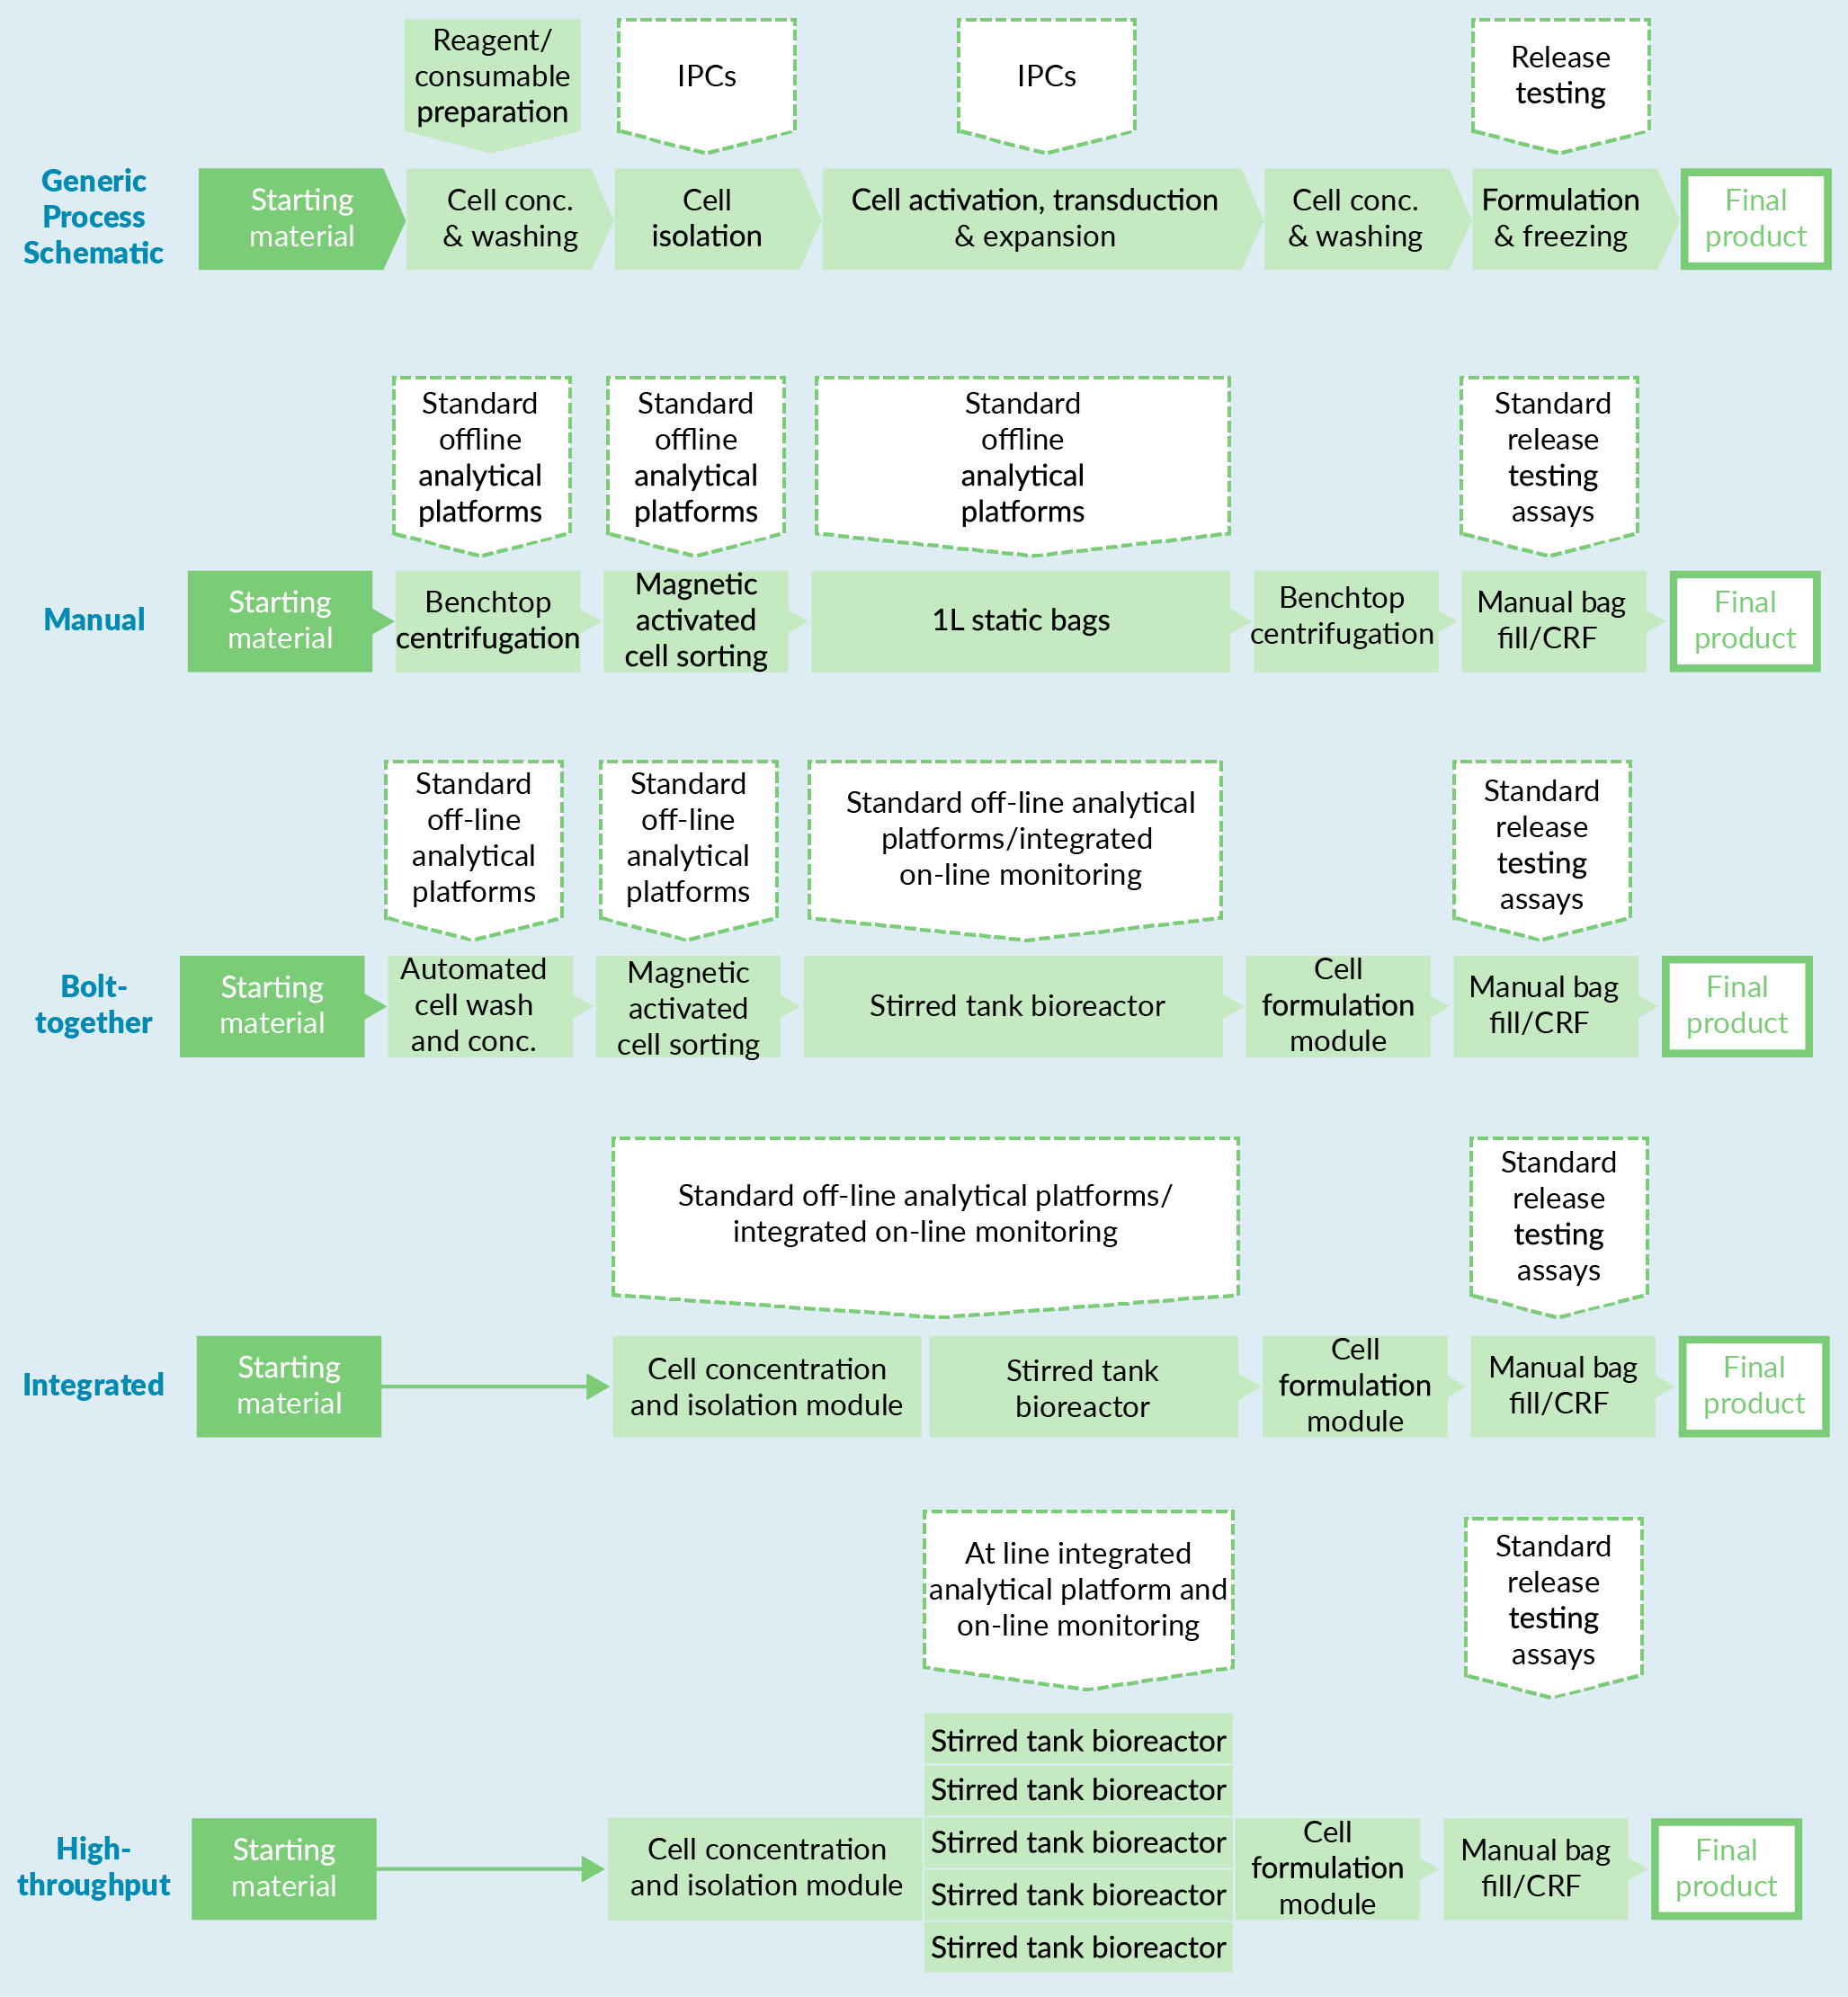
| Table 1. Assumptions and constraints associated with the exemplar CAR-T process modelled in the context of the four levels of automation. | ||
| Hypothetical CAR-T process assumptions | ||
| Process step | Automation level | Assumption |
| Starting material | All | Apheresis (fresh) |
| Cell conc. and washing | Manual | Benchtop centrifugation using commercially available buffer |
| Cell conc. and washing | Bolt Together | Stand-alone closed and automated volume reduction and wash technology – cells washed in commercially available buffer |
| Cell conc. and washing | Integrated High-throughput | Volume reduction and wash technology within integrated platforms. Cells washed into commercially available buffer |
| Cell isolation | Manual | Stand-alone Magnetically Activated Cell Sorting Technology – (CD4/CD8 positive selection) |
| Cell isolation | Bolt Together | Stand-alone Magnetically Activated Cell Sorting Technology – (CD4/CD8 positive selection) |
| Cell isolation | Integrated High-throughput | Magnetically Activated (or equivalent) Cell Sorting Technology integrated into platform design – (CD4/CD8 positive selection) |
| Cell seeding | Manual | 400 million CD3+ cells at 1 million cells/mL in cell expansion bags |
| Cell seeding | Bolt-Together Integrated High-throughput | 100 million CD3+ cells at 1 million cells/mL in STRs |
| Activation | All | CD3/CD28 based Polymeric Nanomatrix activation agent |
| Transduction | All | Lentiviral vector added on day 1 at MOI of 1:1 to CD3+ cells. (Total seeding volume of ‘Manual’ process is 4x other systems and therefore 4x amount of vector is required) |
| Expansion | All | Basal media + 5% human AB serum |
| Expansion | All | Cytokine addition on day 1, 3, 5 (IL-7 and IL-15) through closed processing techniques |
| Expansion | All | Scheduled feeding regime – medium addition on days 3 and 5 (equal to 40% media volume addition in system on each day, so that after two feeds system volume has doubled) |
| Expansion | All | Total process length – 7 days |
| Expansion | Manual | 1 L Bags (maximum working volume 800 mL) – static culture in incubators (1 patient per shelf, 3 patients per incubator) |
| Expansion | Manual | Expected >2.5-fold cell fold expansion |
| Expansion | Bolt Together | Seven individually operated single stirred tank bioreactors operated on various/a single platform(s) |
| Expansion | Integrated | A single stirred tank bioreactor operated as part of integrated platform |
| Expansion | High-throughput | Seven individually operated single stirred tank bioreactors operated on single platform that have centralized common resources for media and cytokine addition |
| Expansion | Bolt Together Integrated High-throughput | Expected >10-fold cell fold expansion |
| Post-expansion cell conc., washing and pre-formulation | Manual | Benchtop centrifugation |
| Post-expansion cell conc., washing and pre-formulation | Bolt Together | Stand-alone closed and automated volume reduction and wash technology |
| Post-expansion cell conc., washing and pre-formulation | Integrated High-throughput | Volume reduction and wash technology in integrated platform |
| Formulation buffer | All | Cryostor10 |
| Formulation | Manual/Bolt Together/Integrated | Manual volume addition of formulation reagents to attain required cell concentration in formulation buffer post-cell count analysis |
| Formulation | High-throughput | In line analytics determine cell count post-wash and initiates volume addition to achieve correct cell concentration in an automated fashion |
| Formulation | All | 1 billion viable CD3+ cell dose. (50 million cells/mL, single bag, 20mL working volume) |
| Freezing | All | Controlled Rate Freezing Technology – performed outside suite – considered non-rate limiting |
| Table 2. Assumptions and constraints associated with the in-process controls for the exemplar CAR-T process modelled in the context of the four levels of automation. | ||
| In-process controls (IPC) and release testing (RT) assumptions | ||
| Test | Process | Definition |
| IPC 1 – Post-wash/pre-cell isolation | Manual Bolt Together Integrated | Off-line viable CD3+ cell count (flow cytometry) |
| IPC 1 – post-wash/pre-cell isolation | High-throughput | At line integrated viable CD3+ cell count (flow cytometry) |
| IPC 2 – post-cell isolation | Manual Bolt Together Integrated | Off-line viable CD3+ cell count (cytometry) |
| IPC 2 – post-cell isolation | High-throughput | At line integrated viable CD3+ cell count (cytometry) |
| IPC 3 – during formulation | Manual Bolt Together Integrated | Off-line viable CD3+ cell count (cytometry) |
| IPC 3 – during formulation | High-throughput | At line integrated viable CD3+ cell count (cytometry) |
| RT – sterility | All | Standard sterility testing of final product – assumed this QC test is outsourced as a standard cost per batch |
| RT – endotoxin | All | Standard endotoxin testing of final product – assumed this QC test is outsourced as a standard cost per batch |
| RT – mycoplasma | All | Standard mycoplasma testing of final product – assumed this QC test is outsourced as a standard cost per batch |
| RT – identity | All | Quantitative flow cytometry-based assay – up to eight identity markers including viability. (includes % transduction). Test is performed in-house by QC team |
| RT – potency assay | All | Cell based killing assay – test is performed in-house by QC team |
| RT – pH | All | pH testing of final product – assumed this QC test is outsourced as a standard cost per batch |
| RT – adventitious agent | All | Process assessed designed to be Xeno free so no adventitious agent testing required for murine, bovine, porcine viruses, etc. Human adventitious agent testing of final product assumed to not be required as it is autologous product and would have been tested as part of patient screening |
| RT – viral copy number per cell | All | Assumed QC test is outsourced as a standard cost per batch |
| RT – integration site analysis | All | Safety assay to address the risk deriving from insertional mutagenesis. Assumed QC test is outsourced as a standard cost per batch |
| IPC: In-process control; RT: Release testing. | ||
The model: set-up & workflow
An overview of the four-step method developed for the model set-up and workflow is defined in Figure 3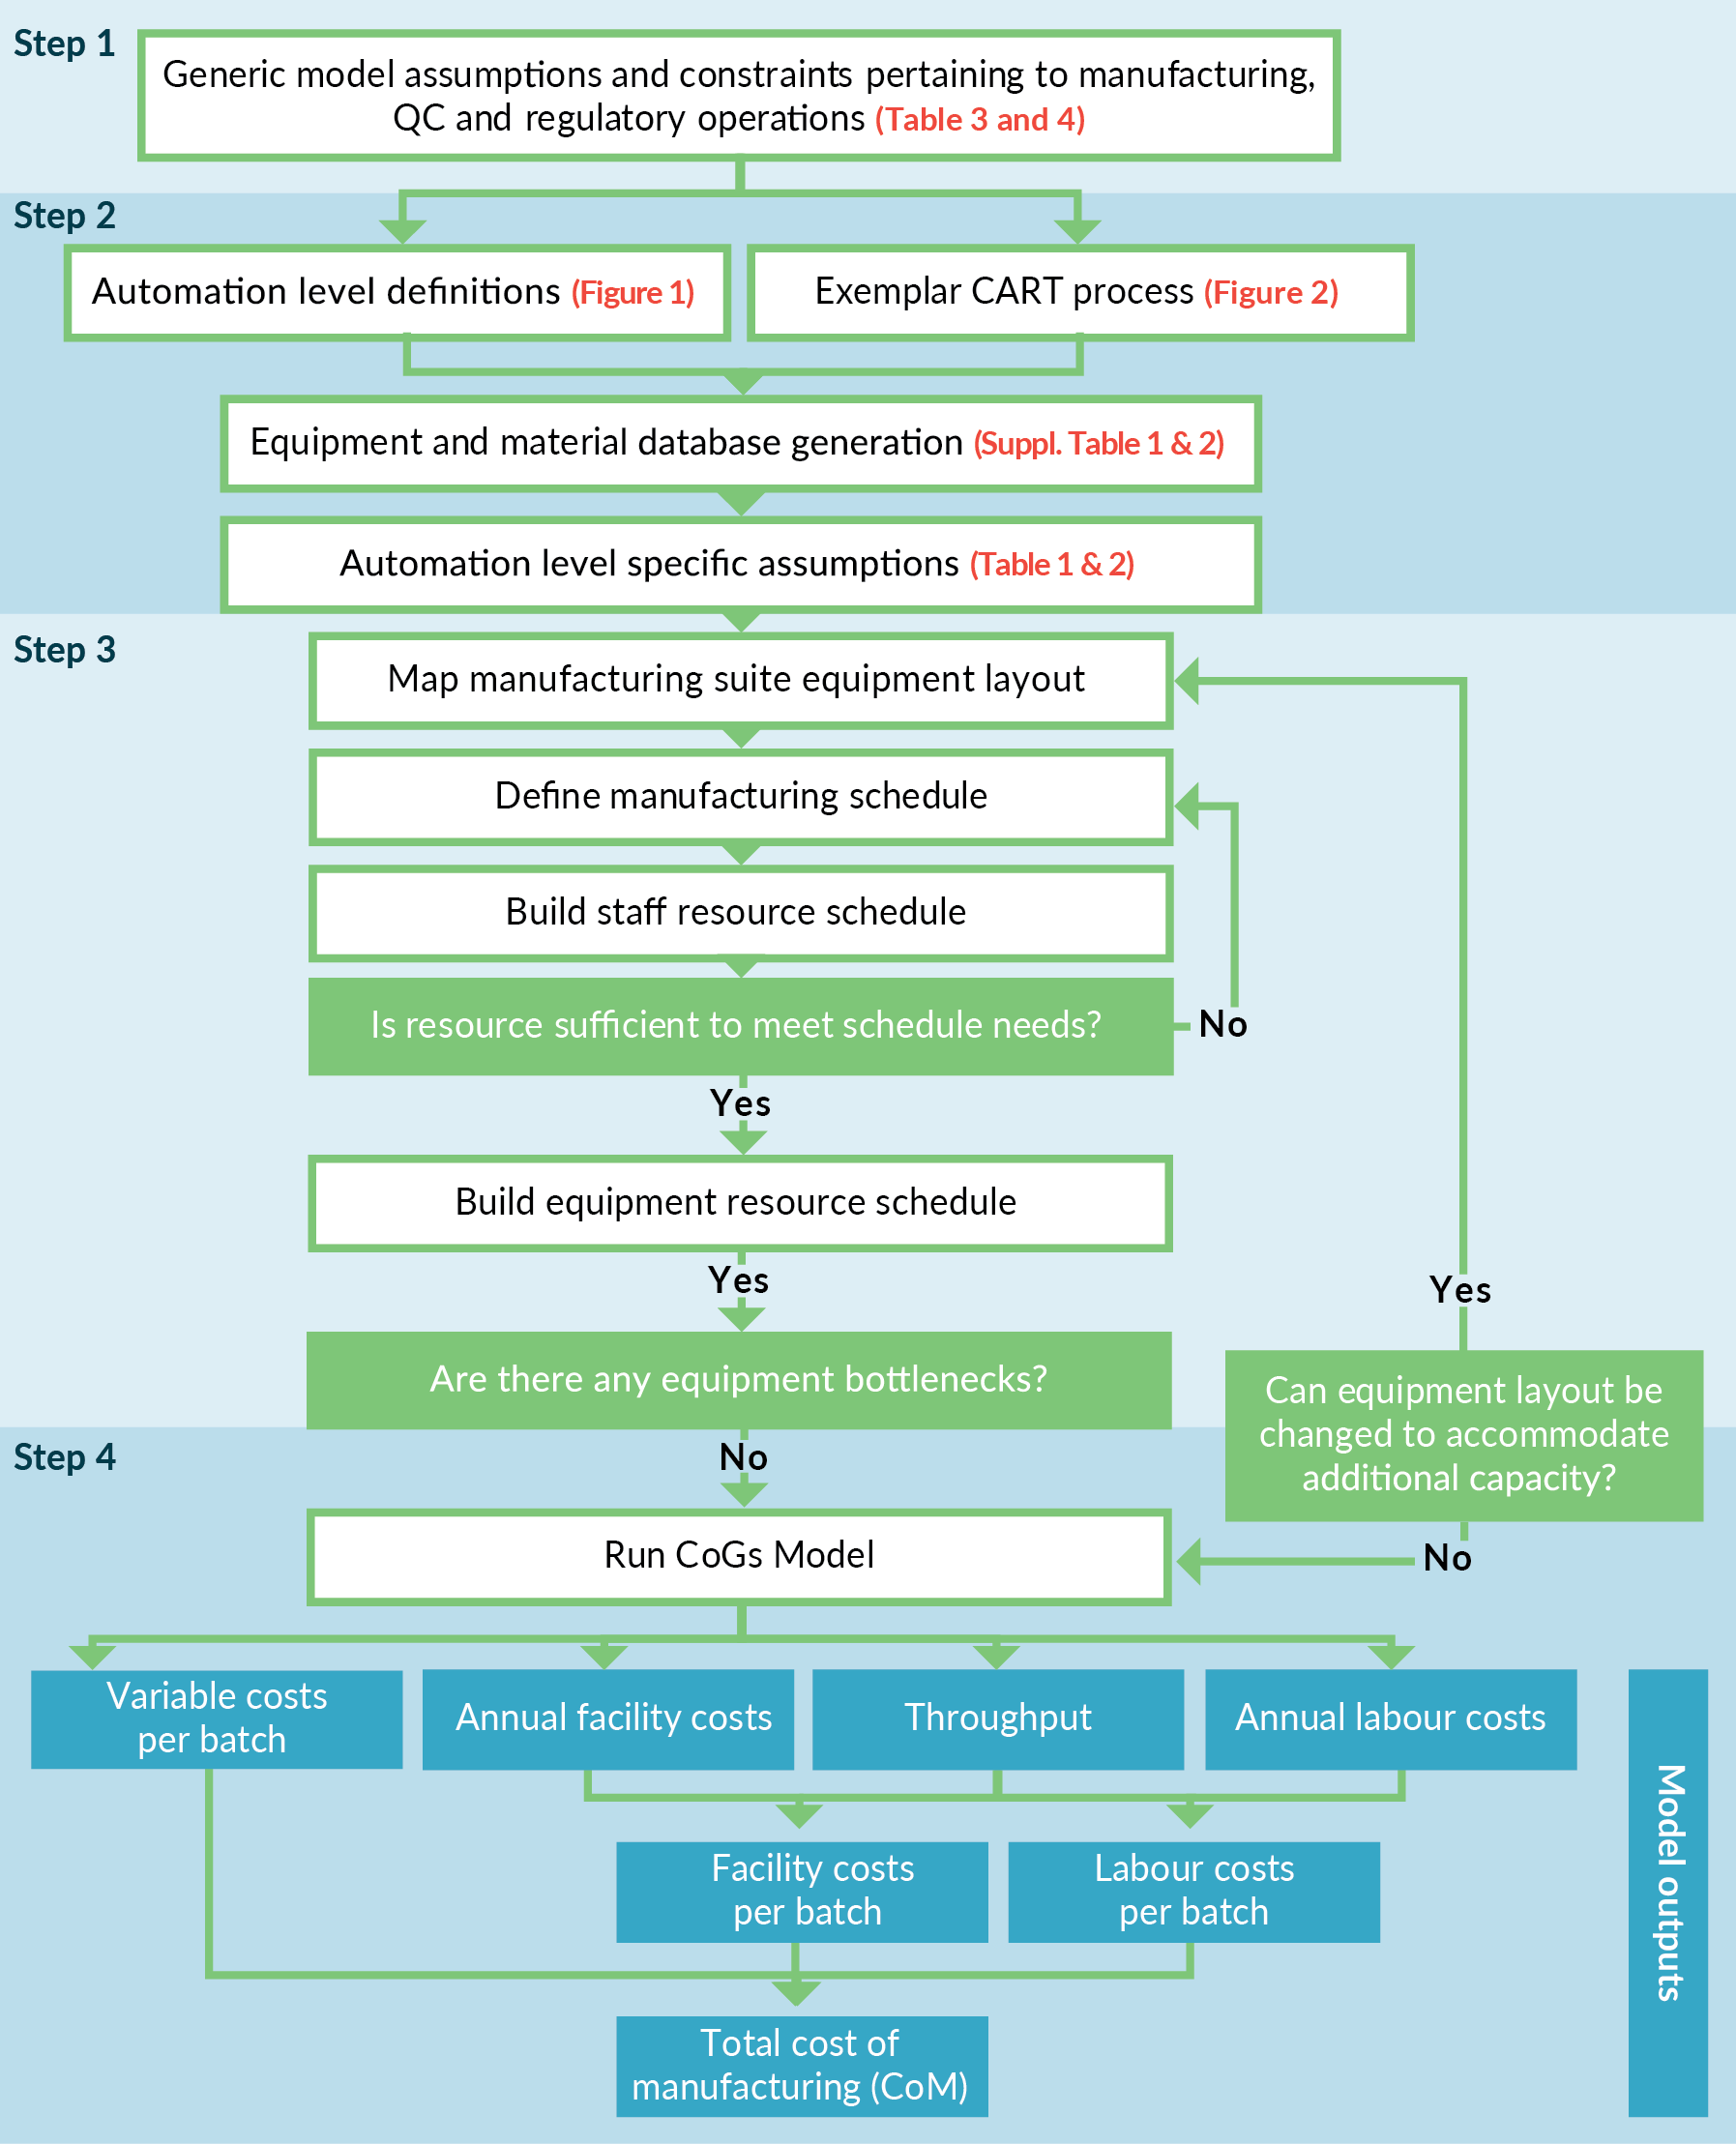
Step 1
Generic model assumptions and constraints, independent of automation level, for the manufacturing suite (and facility) operation (Table 3) and regulatory or quality compliance (Table 4) were defined. Included here is a maximum number of operators working in the clean room at any time due to particle generation.
| Table 3. Assumptions associated with the operation of the manufacturing facility and cleanroom suite, which were utilized for constraining the model and determining the facility associated costs. | |
| Manufacturing facility and cleanroom operational assumptions | |
| No. of cleanroom suites | 1 |
| Cleanroom grade | Grade C |
| Cleanroom footprint | 100m2 |
| Maximum equipment footprint | 65% of total area. This ensured integrity of required work-flows could be maintained (personal flow, waste streams, product streams etc.) |
| Max. no of operators and equipment load per suite | In a real-world scenario these factors are driven by particulate data and the ability to maintain particulate counts below required operating levels (Grade C in this model). It was assumed a combination of equipment and operator particulate generation would allow a maximum of 12 people in the cleanroom suite at one time, in addition to the required equipment for the process being modelled |
| Equipment location | It was assumed equipment could be positioned in a manner that would not compromise air handling/air-flow within the suite and would not impact on material, product or waste stream work-flows |
| Cryoand warehouse facilities | Cryoand warehouse facilities are segregated into another part of facility and are unconstrained in terms of operational/storage capacity |
| QC facilities | QC facilities are based on-site and are unconstrained in terms of operational capacity |
| QC staffing | Each assay required had a ‘processing time’ associated with it. Staffing requirements were calculated based on total time required to perform assays |
| Facility operational period | Maximum of 320 days per annum |
| Cleanroom rental cost | Fixed cost – includes environmental monitoring, gowning, central facility services (e.g., waste management) etc. Analysis of variations in these costs [Data not shown] as a function of the models employed were not considered significant enough to warrant individual inclusion and thus a fixed rate was applied for all models |
| Manufacturing shift length (and maximum working time per day) | 14h (2 x 8h overlapping shift patterns) – during periods where shifts overlap, no more than 12 people would be allowed in the cleanroom at any given time (as per the ‘Max. no of operators and equipment load per suite’) |
| Operator/QC staff working days per annum | 5/2 shifts (224 working days a year per operator, after allowance for 28 days of holiday and 8 bank holidays are accounted for) |
| Batch scheduling | It was assumed that the arrival of patient apheresis material at the manufacturing centre would be managed from a clinical and logistical scheduling perspective to support the proposed manufacturing schedule. Whereby incoming material would be stored for no longer that 24h |
| These were applied to all four levels of automation modelled. | |
Step 2
As described above, discrete levels of automation were defined and translated into CAR-T manufacturing processes based on the exemplar CAR-T process. Specific assumptions as a function of each automation level were captured at this point (Table 1).
| Table 4. Assumptions and constraints associated with regulatory and quality compliance for the modelled processes. | |
| Regulatory and quality assumptions | |
| BMR and counter sign off | It was assumed state of the art electronic traceability system/batch manufacturing records (BMR) would be employed and the role of dual operator sign-off would be reduced as a function of automation level, thereby allowing greater levels of interdependent operator working within increased automation. Where dual sign-off would then only be required at critical process points. To model this the following ‘primary’ to ‘sign-off’ operator ratio was applied to each automation level: 2:1 for Manual 3:1 for Bolt Together 3:1 for Integrated 4:1 for High-Throughput |
| Multi-product segregation | It was assumed that the methods employed could be validated (e.g., through temporal and spatial separation approaches) to facilitate ‘side-by-side’ product manufacture within the same suite/on the same automated platform |
| QP sign-off | It was assumed that 1 x QP can sign-off up to 4 products per day |
| These were applied to all four levels of automation modelled. | |
Step 3
Cleanroom suite equipment layout designs were established and refined in an iterative manner, by determining the number of parallel streams that could be simultaneously processed without exceeding resource or equipment constraints. In brief, we assumed operators could work in an independent fashion with key processing steps having to be verified by a secondary operator in accordance with accepted pharmaceutical good manufacturing practice. The maximum number of ‘processing’ operators required to run each batch per day, were defined to be different dependent on the level of automation. Therefore, one key difference applied in the model was the ratio of ‘processing’ operators to ‘secondary sign-off’ operators required for each automation level. Next, based on maximum number of operators available, the total number of man hours available per suite per day were calculated. We then determined the number of parallel batches possible within the available man hours, keeping in mind the equipment constraints for each option as determined by the current iteration of the suite layout. If a piece of equipment was determined to be a bottleneck, then the additional items would be included, and the above process would be repeated. In this study, only the manual process option was equipment limited, with isolator availability identified as the bottleneck. For the other automation levels, where equipment constraints were not limiting, the scheduling pattern providing the most balanced resource utilization was selected. The finalized suite layouts were visualized using HakoBio Software (OUAT! Live Sciences, Brussels, Belgium) (Figure 1).
Step 4
The model for each automation level created was then run. Each model could be based on constant footprint or constant facility throughputs assumption, to determine the impact on key measured responses (e.g., cost of manufacture, labor requirements etc.). Costs were then extracted from the model and represented as either facility costs (a function of cleanroom rates, equipment depreciation (based on 10-year lifetime) and renewal rates), labor costs (as a function of total staff numbers, including process operators, QC operators and QPs) or variable costs (e.g., raw materials, consumables, QC analysis reagents etc.). Variable costs were calculated on a per batch basis. The facility and labor costs were calculated annually and then divided by the throughput to determine the contribution per batch to the CoM.
The Cost of Manufacturing (CoM) per batch was determined by summing the annual suite (facility and labor) costs, dividing by the number of manufactured batches per suite, per year (throughput), and then adding the variable costs per batch.
Results
Cost of manufacturing per batch (CoM) & annual throughput
Figure 4A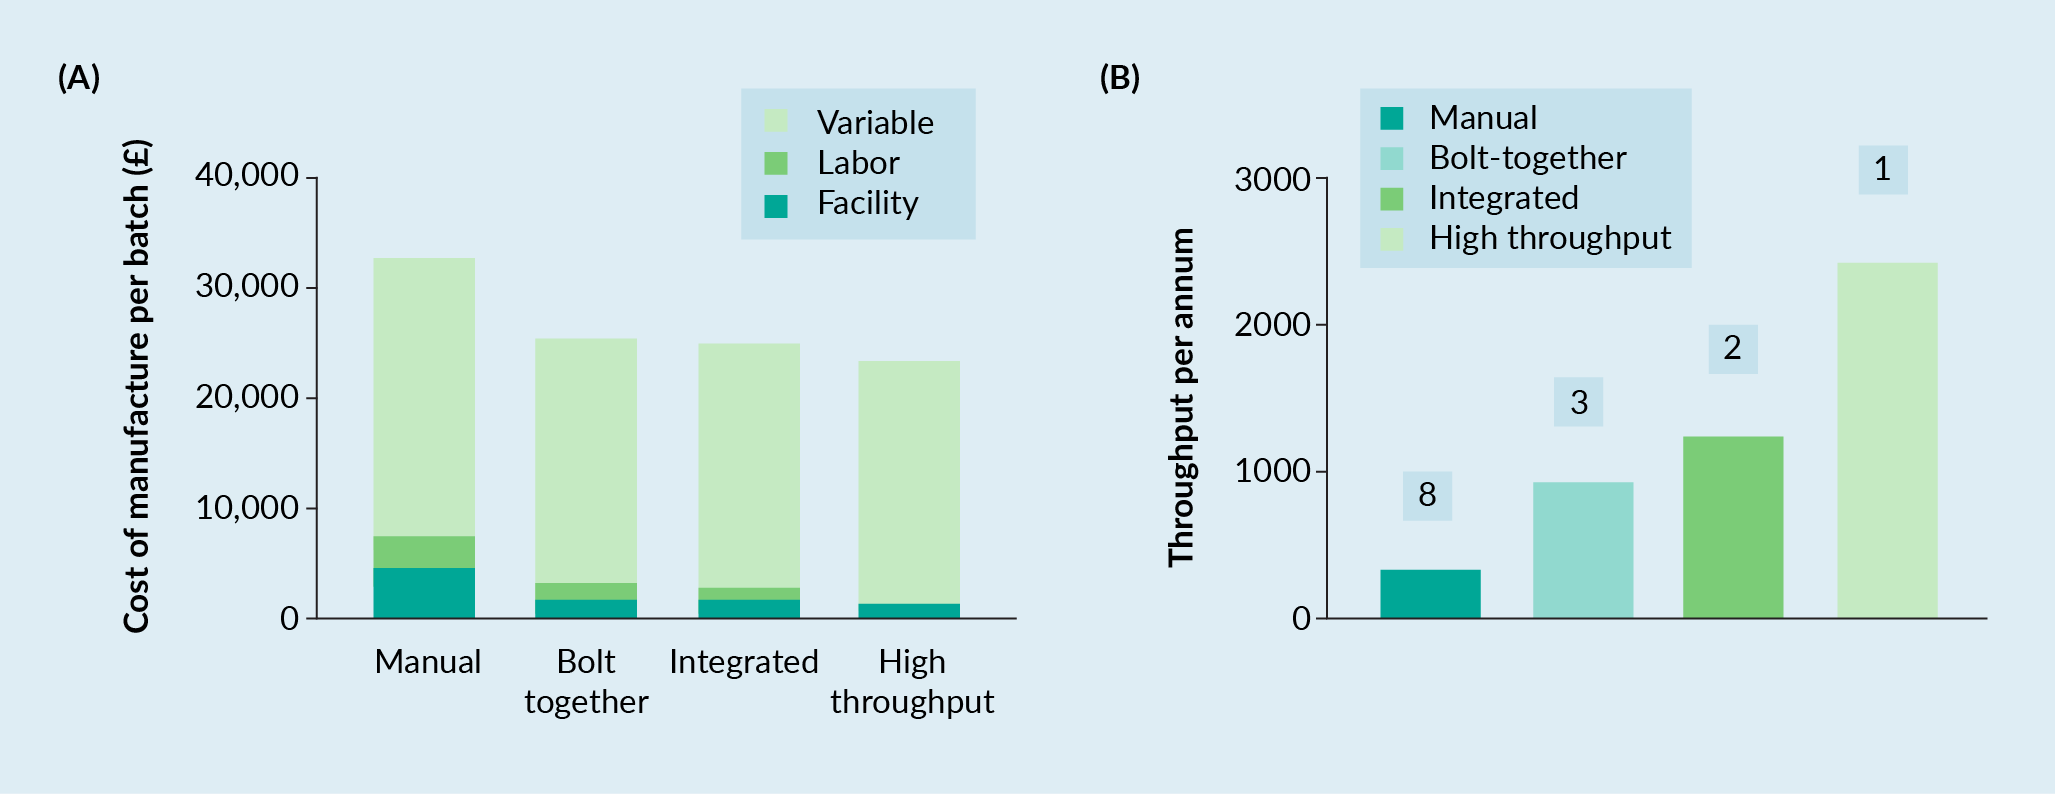
Further analysis of Figure 4A revealed that almost all the batch cost could be attributed to the variable costs for the Bolt-Together, Integrated and High-Through automation strategies (86, 88 and 94% of the total cost, respectively). This was a function of the fixed facility costs being averaged across an increasing number of batches, reducing them to an appreciably small percentage of the total costs (3–7%).
To determine the number of equivalent manufacturing suites required for the manual, bolt-together and integrated automation levels to achieve the same throughput as the ‘high-throughput’ automation level, the model was switched from a ‘constant footprint’ to ‘constant throughput’ scenario, whereby the ‘high-throughput’ result (2436 batches per annum) was used as the target value. From this analysis the Manual, Bolt-Together and Integrated automation levels required 8, 3 and 2 suites respectively to achieve the same throughput (Figure 4B). Scaling out of the Manual, Bolt-Together and Integrated automation levels had a minimal impact on the total batch cost or the percentage distribution of facility, labor and variable costs (<1%) [Data Not Shown].
The model output in relation to facility staffing and productivity, as a function of automation level, is illustrated in Figure 5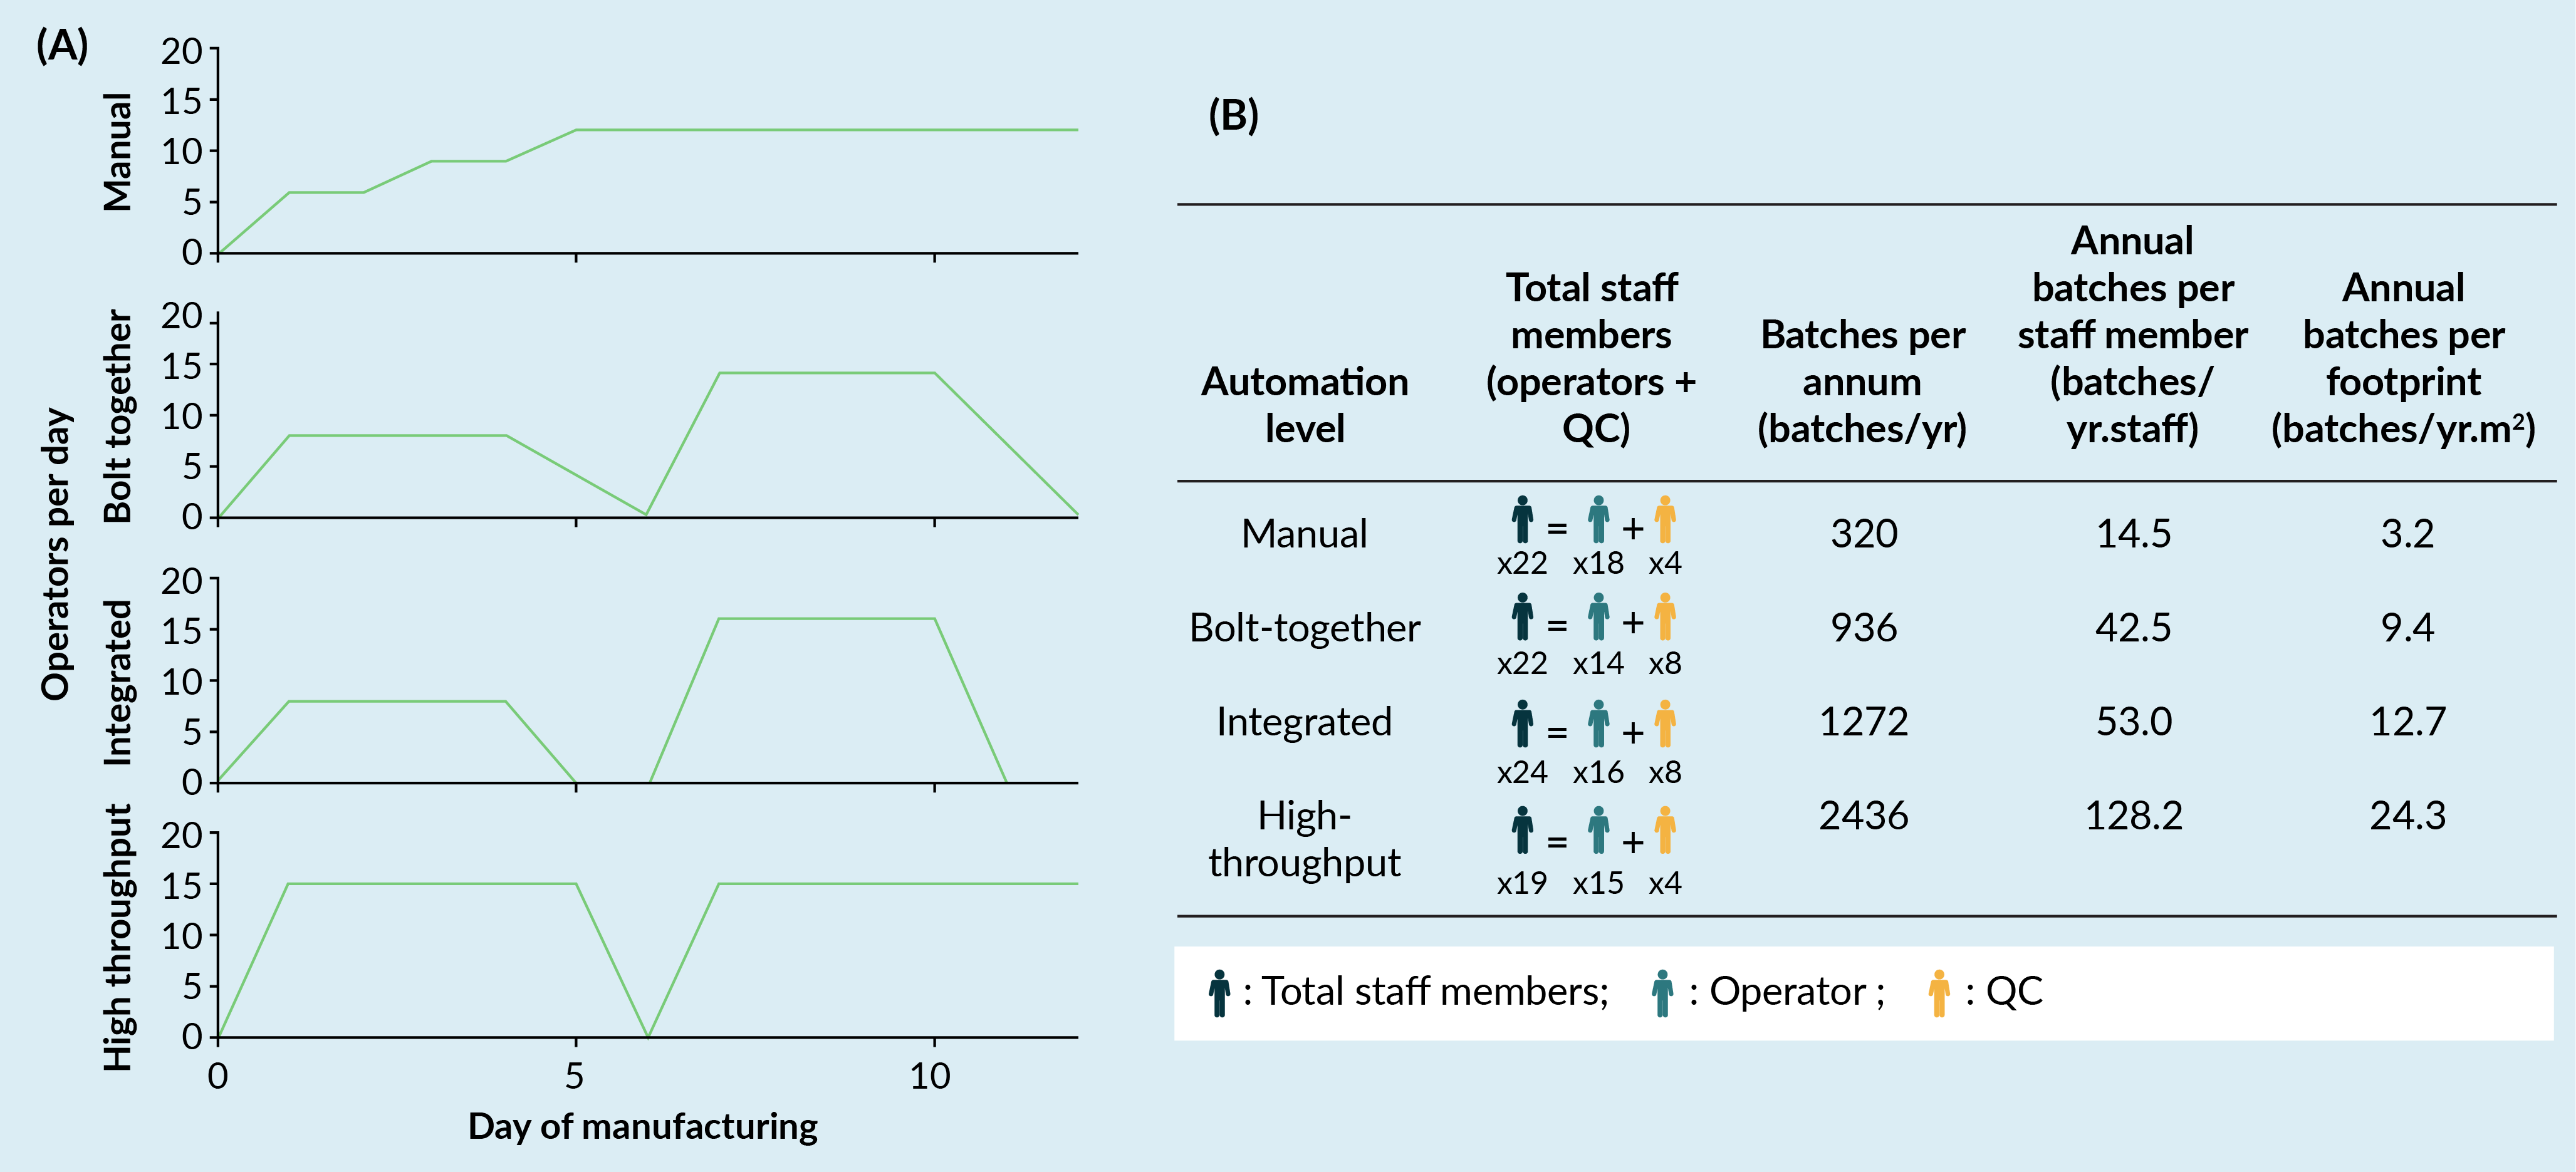
Interestingly, workforce composition between Operators and Quality Control (QC) changed as a function of automation level (Figure 5A). For a Manual automation level, the ratio of operators (18 Staff) to QC (4 staff) was 4.5:1 reflecting the highly labor-intensive nature of the process and low QC throughput as a result. Bolt-Together and Integrated automation levels had ratios of Operator to QC staff of 1.75:1 and 2:1, respectively, with total Operator numbers reducing in comparison to the Manual automation level (14 and 16 staff, respectively) and QC staff increasing (8 staff for both). This reflects the assumptions built into the model whereby the use of automation improves operator efficiencies, but not QC and thus, increased QC support is required to accommodate the increasing production capability. For the High-Throughput automation level we see Operator numbers stay constant compared to other automation levels (15 staff), but QC staff numbers reduce to four. This illustrates the value potential of the assumed in-built analytics which reduces the QC burden associated with running in-process controls.
When considered in the context of the overall annual throughput per staff member, productivity was significantly enhanced from 14.5 batches/staff member for Manual to 128.2 batches/staff member for High-Throughput, whilst Bolt-Together and Integrated automation showed similar figures at approximately 42.5 and 53.0 batches/staff member (Figure 5B).
Annual throughput per unit footprint also increased as a function of automation level, from a baseline of 3.2 batches/m2 for a Manual, to 24.3 batches/m2 for High-Throughput. This highlights that whilst staff numbers remain reasonably constant and footprint is fixed, the value of each staff member or each square meter becomes much greater with the implementation of automation.
Upfront capital investment
Whilst supporting higher throughputs and lower CoM, the potential drawback of automation lies in the significant upfront capital investment to realize these benefits. From solely a capital expenditure perspective, facility set-up for the Bolt-Together automation strategy required 2x the investment compared to Manual, whilst Integrated and High-Throughput solutions required 5–6x the capital investment (albeit they delivered 4–8x the productivity). The scalability of automation is a substantial advantage as it facilitates incremental expansion (or reduction) of the process, if required, much more efficiently and with better control (leading to lower failure rates). Furthermore, this capital expenditure is to realize the full throughput potential of each suite. In terms of business strategy, it is much more likely that company will experience a ramp up phase in production as they expand their reach within the respective market space, thus it may be feasible to stage this capital expenditure outlay.
Discussion
The work examines cost and productivity sensitivities to increasing automation of the manufacturing processes for cell-based immunotherapies. Manual, Bolt-Together and Integrated automation solutions were all modelled upon existing automation strategies currently available, wholly or in-part, to therapy developers. The High-Throughput automation level was a hypothetical vision; a system with integrated analytics (cell counting/flow cytometry to support cell selection and formulation) and parallelized expansion for multiple batches concurrently. Although the system has not been realized yet, the power of modelling tools can still demonstrate the value of such systems, thereby supporting the business case for their development. Critical to this analysis are the assumption provided in Tables 1–4, as well as the Supplementary Tables.
We demonstrated that the introduction of automation at the Bolt-Together level reduced the CoM by 23% compared to Manual processing, with Integrated automation showing a marginal improvement (24% decrease) and High-Throughput enabling additional cost reductions (30% decrease). More significantly, automation adoption delivered much greater throughputs (batches/yr) (Manual 320, Bolt Together 936, Integrated 1272, High Throughput 2436, respectively). Thus, the reduction in CoM observed could be primarily attributed to automation increasing throughput and diminishing facility costs proportionally (from 14% for manual to 3–7% for other automation levels). Secondly, increasingly efficient use of the manufacturing team, as a function of automation adoption, yielded reduced labor costs (from 10% for Manual, to 5–6% for Bolt-Together/Integrated, and 2% for High-Throughput) per batch. Furthermore, adoption of automation creates a different set of operator skill requirements to that of manual, which could be argued are easier to recruit for and train-up on when establishing a manufacturing team (especially operators). This may be counter balanced by the need for greater numbers of QC staff (for bolt-together and integrated platforms), however, at a time when the forecast recruitment needs vastly outstrips supply [19]Cell and Gene Therapy Catapult. UK cell and gene therapy skills demand report 2019: https://ct.catapult.org.uk/sites/default/files/publication/Catapult_01_UK%20Skills%20Demand%20Report%202019_published_v2.pdf, the ability to maximize the number of batches per staff member is greatly beneficial. The authors recognize that the upfront development of automation is costly and time consuming and developers often decide against it during the early stages of development. The impact unfortunately, is that from a regulatory perspective you get ‘locked-in’ to your process reasonably early within the development lifecycle. When funding and resources are then more amenable, it becomes significantly more challenging, but not impossible, to implement; not just through the cost of developing the new process, but the costs of showing comparability and through obtaining commercial licenses etc. Hence the automation need at commercial scale should be identified early in the development lifecycle, so it can be built-in to the development plan, with a view to minimize the cost (and risk) of subsequent requirements to change. The authors expect it to take in the region of 9–15 months for development teams to translate a process similar to the exemplar manual process herein, to something reflecting a bolt-together or integrated solution at an estimated cost in the region of £0.75–1.5 million (Note this can be highly depended on the size of the development team employed, the technologies being applied and doesn’t include the capital expenditure required to set-up the development laboratory with the technologies being adopted, the cost associated with formal comparability studies (which may be significant if non-clinical work needs to be repeated or clinical bridging studies undertaken).
As we sought to maximize throughput during model set-up, the challenges associated with the scalability of the manual process became apparent. We set out an iterative decision tree to assist developers in planning manufacture to maximize capacity, see Figure 3. The Manual process required considerable isolator usage, which made it time inefficient and, in this study, became the primary bottleneck. When this was coupled with a manufacturing protocol requiring operator interventions across multiple process days, the result was an equipment unit operation with a very low throughput (mean of 0.5 batch/day in this study).
As this model assumes unimpeded supply of patient apheresis material, the process design is of maximum suite capacity. Therefore, labor and facility contributions to CoM were minimized. The reality is that apheresis supply is likely to be uneven, a result of many contributing factors including clinical slot availability, logistic considerations [20]Ellison S, McCoy R, Bell M et al. Logistics by design: a framework for advanced therapy developers to create optimal Logistics Platforms. Cell Gene Ther. Ins. 2018; 4(10): 1019–40. and manufacturing/scheduling strategies. Implementation of starting material cryopreservation is one strategy being utilized by developers to help to smooth starting material supply into the facility and therefore maximize throughput. Our model (Figure 4) suggests that the automated strategies could accommodate significant reductions in throughput without a significant change in CoM as the facility contribution was a very low proportion of the total CoM (e.g., 3–7% with decreasing automation level). Variable costs therefore accounted for the majority of CoM for Bolt-Together, Integrated and High-Throughput (88, 89 and 94%, respectively), as process automation afforded higher throughput. Targeting key variable cost drivers is therefore paramount to achieving further cost reductions. Typically, factors such as gene delivery vector, selection antibodies, cytokines and single use disposable kits are high cost items, representing opportunities for savings. A significant proportion of this cost is driven by the scale of operations for a single batch and the efficiencies of individual unit operations. As therapeutic mechanisms of action understanding for immunotherapies improves, quality attributes deemed critical (CQAs) will be refined. It is expected then that the field will shift towards lower dose, but higher purity and potency products. This in turn, is projected to reduce physical scale and processing times for individual autologous batches. Coupled with the incorporation of emerging technologies, such as non-viral gene delivery systems, the future looks promising with respect to significantly reducing the variable cost proportion of autologous ATMP manufacture.
High variability in CoGs model structure exists between groups, particularly around assumptions and constraints applied, making it challenging to compare their outputs. However, a recent publication by James [21]James D. How short-term gain can lead to long-term pain. Cell Gene Ther. Ins. 2017; 3(4): 271–84.James D. How short-term gain can lead to long-term pain. Cell Gene Ther. Ins. 2017; 3(4): 271–84., which also utilized modelling approaches to examine the impact of automation adoption on CAR-T manufacture, showed a number of parallels to our own. It illustrates similar levels of cost reduction to this study through the application of automation for a “closed automated system with centralized incubation” (22% CoGs reduction compared to 25–25% in this study). When comparing both models, manual processes showed comparable annual throughput per unit area, and per staff member, (2.1 and 3.2 batches/yr.m2, and 14.5 and 19 batches/yr.staff, respectively). Whilst James’ “closed automated system with centralized incubation” strategy showed a significantly lower throughput per unit area (10 batches/yr.m2) compared to our ‘high-throughput’ strategy (24.3 batches/yr.m2), the staff productivity in his model was significantly higher (153 to 128 batches/yr.staff, respectively). By evaluating the assumptions behind these metrics, we can hopefully start to understand what has led to the variations observed. For example, we hypothesized that the higher throughput per unit area in our study can be attributed to the use of STRs as the expansion system. These systems use heating jackets to maintain temperature, which in turn result in a zero impact on footprint in addition to the baseline consumables or equipment, rather than requiring additional incubator resources and associated footprint.
In addition to reducing CoGs, automation offers improved process robustness and the reduced risk of batch failure. This is a critical factor especially for autologous therapies where a repeat batch may not be possible for a patient that is progressing clinically. It is highly challenging to quantify such parameters as a function of automation level, but qualitatively however, it is possible to surmise at the potential impact. Automation naturally tends to adoption of closed processing technologies, reducing operator interventions/manipulations. This in turn, decreases risks associated with microbial contamination (during manufacture and due to decreased ‘spray and wipe’ load), or operator induced errors. Furthermore, automation opens the door for adaptive control strategies whereby in-built analytics measure, and feedback control directs process decisions to reach key target parameters, thus reducing batch failure rates. Importantly however, the high initial capital expenditure follows the law of diminishing returns, whereby the majority of risk reduction and removal of ‘process hazards’ can be achieved with semi-automated solutions (such as the Bolt-Together and Integrated automation in this study) [21]James D. How short-term gain can lead to long-term pain. Cell Gene Ther. Ins. 2017; 3(4): 271–84.James D. How short-term gain can lead to long-term pain. Cell Gene Ther. Ins. 2017; 3(4): 271–84.. Thus, investment in automation beyond this level, purely for risk reduction purposes, should be considered cautiously as the value is diminished.
From a more overarching perspective, as automation level increases, single batches become increasingly tied into a single item of equipment, which in the case of high-throughput means you have multiple batches ‘operational’ on a single item of equipment at any given time. The consequence of this is you become more exposed from a risk perspective to failure of that automated system. Furthermore, increasing levels of automation, typically translates to increasing single supplier dependencies (especially for integrated and ‘high-throughput’ systems). Thus, as the manufacturer, you become increasingly exposed to the ability of that supplier to meet your daily operational needs, thus co-evolutionary collaborations will be critical in ensuring automation technology providers are capable of growing in line with individual therapy developers and the broader community.
The concept of High Throughput has not been coined in this paper, as this has been a point of discussions at the recent Phacilitate Special Interest Group automation meetings [22]Ball O, Robinson S, Bure K et al. Bioprocessing automation in cell therapy manufacturing: Outcomes of special interest group automation workshop. Cytotherapy 2018; 20(4): 592–9.. However, to the authors’ knowledge this is the first publication analyzing cost or production implications of this concept, where patient material can be manufactured in parallel. This study demonstrates clear commercial benefits, but important engineering and regulatory challenges need to be addressed if High Throughput is to be realized for ATMP manufacture.
Conclusion
Immunotherapy development, specifically for CAR-T and TCR focused products, is a rapidly changing landscape. The processes of 5 years ago are considerably different to today and will be very different again in 5 years’ time. Automation allows the development of de-risked manufacturing processes, enabling increased throughput and reduced CoM. It is therefore a critical aspect of scalable manufacture, in order to support commercial viability and that these novel medicines can be supplied to the populace. Each product and process is unique. Therefore, the degree of automation adoption should be tailored to the manufacturing needs and supply level demands. We have demonstrated the value to therapy developers of employing modelling tools to support early stage manufacturing development decision making in relation to assessing automation adoption strategies. Embracement of these tools can only make the development process stronger.
References
1. Lee DW, Kochenderfer JN, Stetler-Stevenson M et al. T cells expressing CD19 chimeric antigen receptors for acute lymphoblastic leukaemia in children and young adults: a phase 1 dose-escalation trial. The Lancet 2015; 385(9967): 517–28. Crossref
2. Maude SL, Frey N, Shaw PA et al. Chimeric Antigen Receptor T Cells for Sustained Remissions in Leukemia. N. Eng. J. Med. 2014; 371(16): 1507–17. Crossref
3. Maus MV, Grupp SA, Porter DL et al. Antibody-modified T cells: CARs take the front seat for hematologic malignancies. Blood 2014; 123(17): 2625. Crossref
4. Schuster SJ, Bishop MR, MD, Tam CS et al. Primary Analysis of Juliet: A Global, Pivotal, Phase 2 Trial of CTL019 in Adult Patients with Relapsed or Refractory Diffuse Large B-Cell Lymphoma. Blood 2017; 130(Suppl 1): 577. Crossref
5. Borchmann P, Jäger U, McGuirk JP et al. An updated analysis of JULIET, a global pivotal Phase 2 trial of tisagenlecleucel in adult patients with relapsed or refractory (r/r) diffuse large b-cell lymphoma (DLBCL). In: The 23rd Congress of EHA. 2018. Stockholm, Sweden. Crossref
6. Alliance Regenerative Medicine. Quarterly Regenerative Medicine Sector Report – Q3 2019: https://alliancerm.org/publication/q3-2019-data-report/ Crossref
7. Jarosławski S, Toumi M. Sipuleucel-T (Provenge®) – Autopsy of an Innovative Paradigm Change in Cancer Treatment: Why a Single-Product Biotech Company Failed to Capitalize on its Breakthrough Invention. Vol. 29. 2015. Crossref
8. uniQure, uniQure announces it will not seek marketing authorization renewal for Glybera in Europe. 2017. Crossref
9. Abou-El-Enein M, Elsanhoury A, Reinke P. Overcoming Challenges Facing Advanced Therapies in the EU Market. Cell Stem Cell 2016; 19(3): 293–7. Crossref
10. Granzin M, Soltenborn S, Müller S et al. Fully automated expansion and activation of clinical-grade natural killer cells for adoptive immunotherapy. Cytotherapy 2015; 17(5): 621–32. Crossref
11. Levine BL, Miskin J, Wonnacott K et al. Global Manufacturing of CAR T Cell Therapy. Mol. Ther. Meth. Clin. Dev. 2017 4(Suppl. C): 92–101. Crossref
12. Brindley DA, Smith JA, Reeve B et al. Automation of CAR-T Cell Adoptive Immunotherapy Bioprocessing: Technology Opportunities to Debottleneck Manufacturing. BioProcess Int. 2016; 14(4): 22–31. Crossref
13. McCall. Rapporteurs’ Report. in Phacilitate Automation – Special Interest Group. 2017. Edinburgh. Crossref
14. Hassan S, Simaria AS, Varadaraju H et al. Allogeneic cell therapy bioprocess economics and optimization: downstream processing decisions. Regen. Med. 2015; 10(5): 591–609.
15. Jenkins MJ, Farid SS. Cost-effective bioprocess design for the manufacture of allogeneic CAR-T cell therapies using a decisional tool with multi-attribute decision-making analysis. Biochem. Eng. J. 2018; 137: 192–204.
16. Simaria AS, Hassan S, Varadaraju H et al. Allogeneic cell therapy bioprocess economics and optimization: single-use cell expansion technologies. Biotechnol. Bioeng. 2014l 111(1): 69–83.
17. Lopes AG, Sinclair A, Frohlich B. Cost Analysis of Cell Therapy Manufacture: Autologous Cell Therapies, Part 1. Bioprocess Int. 2018; 16(3): 3–9. Crossref
18. Lopes AG, Sinclair A, Frohlich B. Cost Analysis of Cell Therapy Manufacture Autologous Cell Therapies, Part 2. Bioprocess Int. 2018; 16(4): 12–9. Crossref
19. Cell and Gene Therapy Catapult. UK cell and gene therapy skills demand report 2019: https://ct.catapult.org.uk/sites/default/files/publication/Catapult_01_UK%20Skills%20Demand%20Report%202019_published_v2.pdf Crossref
20. Ellison S, McCoy R, Bell M et al. Logistics by design: a framework for advanced therapy developers to create optimal Logistics Platforms. Cell Gene Ther. Ins. 2018; 4(10): 1019–40. Crossref
21. James D. How short-term gain can lead to long-term pain. Cell Gene Ther. Ins. 2017; 3(4): 271–84. Crossref
22. Ball O, Robinson S, Bure K et al. Bioprocessing automation in cell therapy manufacturing: Outcomes of special interest group automation workshop. Cytotherapy 2018; 20(4): 592–9. Crossref
Affiliations
Ryan McCoy
Cell and Gene Therapy Catapult, London, UK
Jahid Hasan
Cell and Gene Therapy Catapult, London, UK
Stephen Ward
Cell and Gene Therapy Catapult Manufacturing Centre, Hertfordshire, UK
Nicholas Gaddum
Cell and Gene Therapy Catapult, London, UK
Authorship & Conflict of Interest
Contributions: All named authors take responsibility for the integrity of the work as a whole, and have given their approval for this version to be published.
Acknowledgements: None.
Disclosure and potential conflicts of interest: The authors declare that they have no conflicts of interest.
Funding declaration: The authors received no financial support for the research, authorship and/or publication of this article.
Article & copyright information
Copyright: Published by Cell and Gene Therapy Insights under Creative Commons License Deed CC BY NC ND 4.0 which allows anyone to copy, distribute, and transmit the article provided it is properly attributed in the manner specified below. No commercial use without permission.
Attribution: Copyright © 2020 McCoy R, Hasan J, Ward S & Gaddum N. Published by Cell and Gene Therapy Insights under Creative Commons License Deed CC BY NC ND 4.0.
Article source: Invited; externally peer reviewed.
Submitted for peer review: Feb 20 2020; Revised manuscript received: May 4 2020; Publication date: Jun 8 2020.